
View usage and analytics
View usage and analytics
The ‘Overview’ tab for a network provides valuable insights into the usage of your charging network. It enables network operators and administrators to monitor charging activity, analyse charging point utilisation, understand members’ usage patterns and assess the network’s overall performance.
By regularly analysing the data, administrators can identify under-utilised charging points, optimise pricing strategies, plan future infrastructure expansion and ensure a reliable charging experience for all network members.
This page explains how to navigate the ‘Analytics’ section, interpret the available metrics, analyse charging sessions and use the data to make informed operational decisions.
Accessing the Analytics Dashboard
To access network analytics:
The Overview dashboard provides an overview of the network’s charging activity using overview maps, charts and detailed reports.
The information available may vary depending on your assigned role and permissions.
Note: Only users with the appropriate permissions (e.g. network operators or administrators) can access the network analytics for all users.
Note: A user can view their own usage analytics without requiring additional permissions.
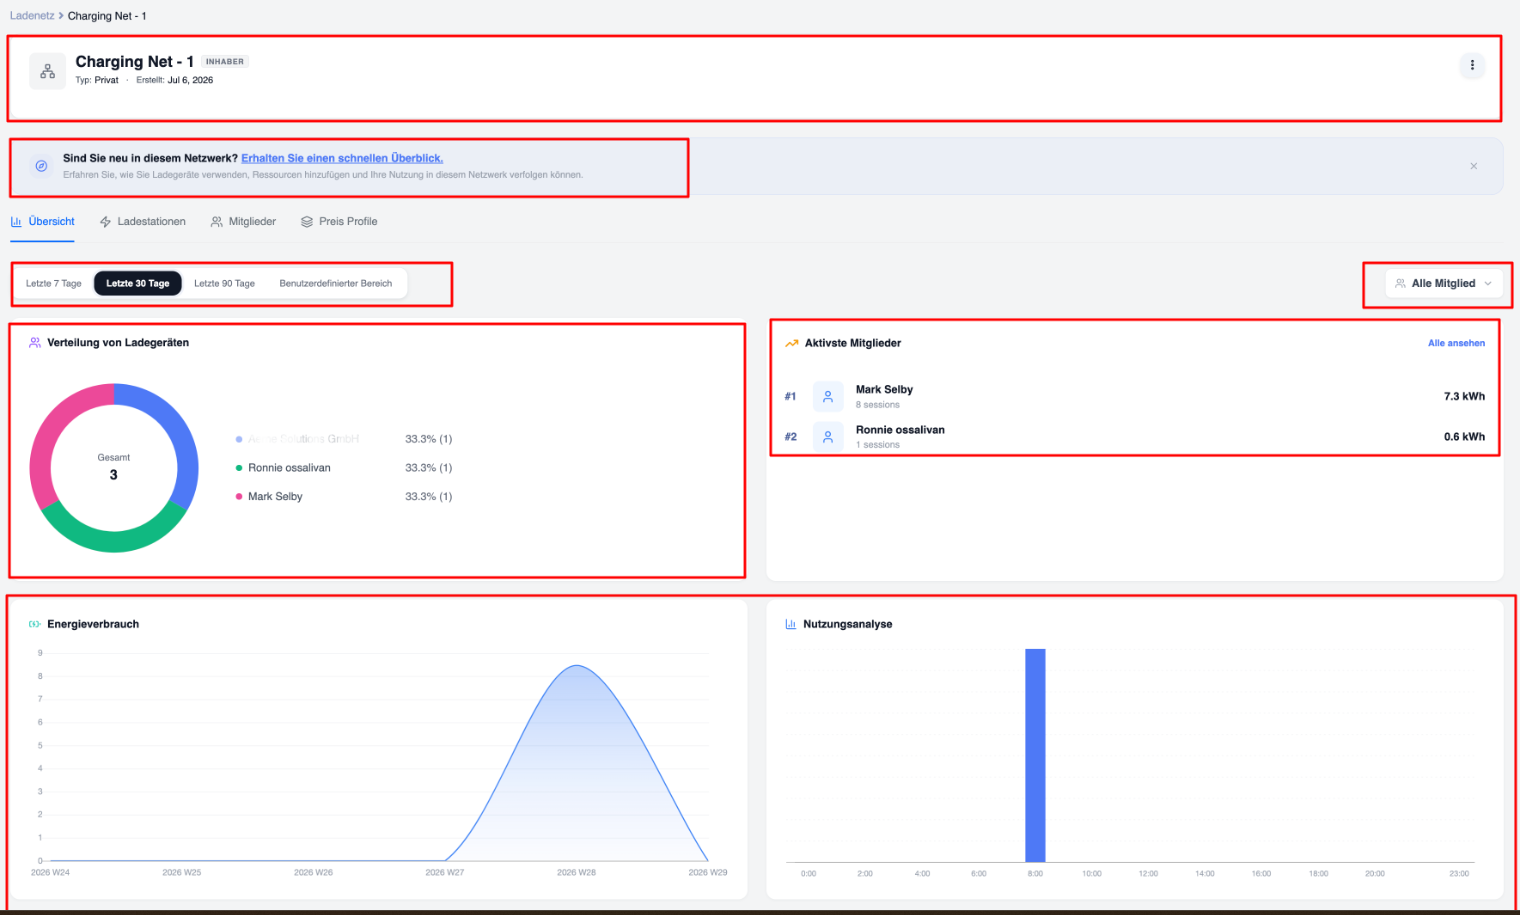
Dashboard Overview
The analytics dashboard provides a brief summary of your charging network’s performance during the selected reporting period.
Typical dashboard widgets include:
- Distribution of charging points across the network
- Activity of active members
- Number of charging sessions
- Total energy consumption
- Graph showing energy consumption over time
- Number of active charging sessions (peak times)
- All charging sessions
- Charger used for the charging session
- Member’s name
- Energy consumed
- Start and end times of the charging session
These overview charts provide an immediate overview of network performance without administrators having to analyse individual charging sessions.
Selecting a date range
These analyses can be filtered using a date filter and a drop-down menu to review individual users’ activity
Common date filters include:
-
Last 7 days
-
Last 30 days
- Last 90 days
-
Custom time period
Changing the date range updates all dashboard statistics and charts
Understanding dashboard metrics
The dashboard displays several key performance indicators (KPIs) that can be used to measure network activity.
Total number of download sessions
This metric shows the total number of download sessions completed within the selected time period.
A download session begins when a user successfully starts the download process and ends when the session is stopped or completed.
Monitoring session volume helps to determine: an increasing number of sessions generally indicates higher network adoption.
Total energy supplied
This metric indicates the total amount of energy supplied at all charging points.
Active members
This metric shows the 5 most active members based on the number of charging sessions (clicking ‘Show all’ displays the details of all members).
Monitoring active members helps to determine:
-
User activity
-
Network adoption
A large number of registered members with very few active users may indicate that pricing needs to be reviewed or the accessibility of charging points improved.
Charging sessions
The ‘Charging Sessions’ report provides a detailed overview of all charging sessions completed on the network.
Each session typically includes:
- Charging point
-
Member’s name
-
Start time
-
End time
-
Energy supplied
-
Session status
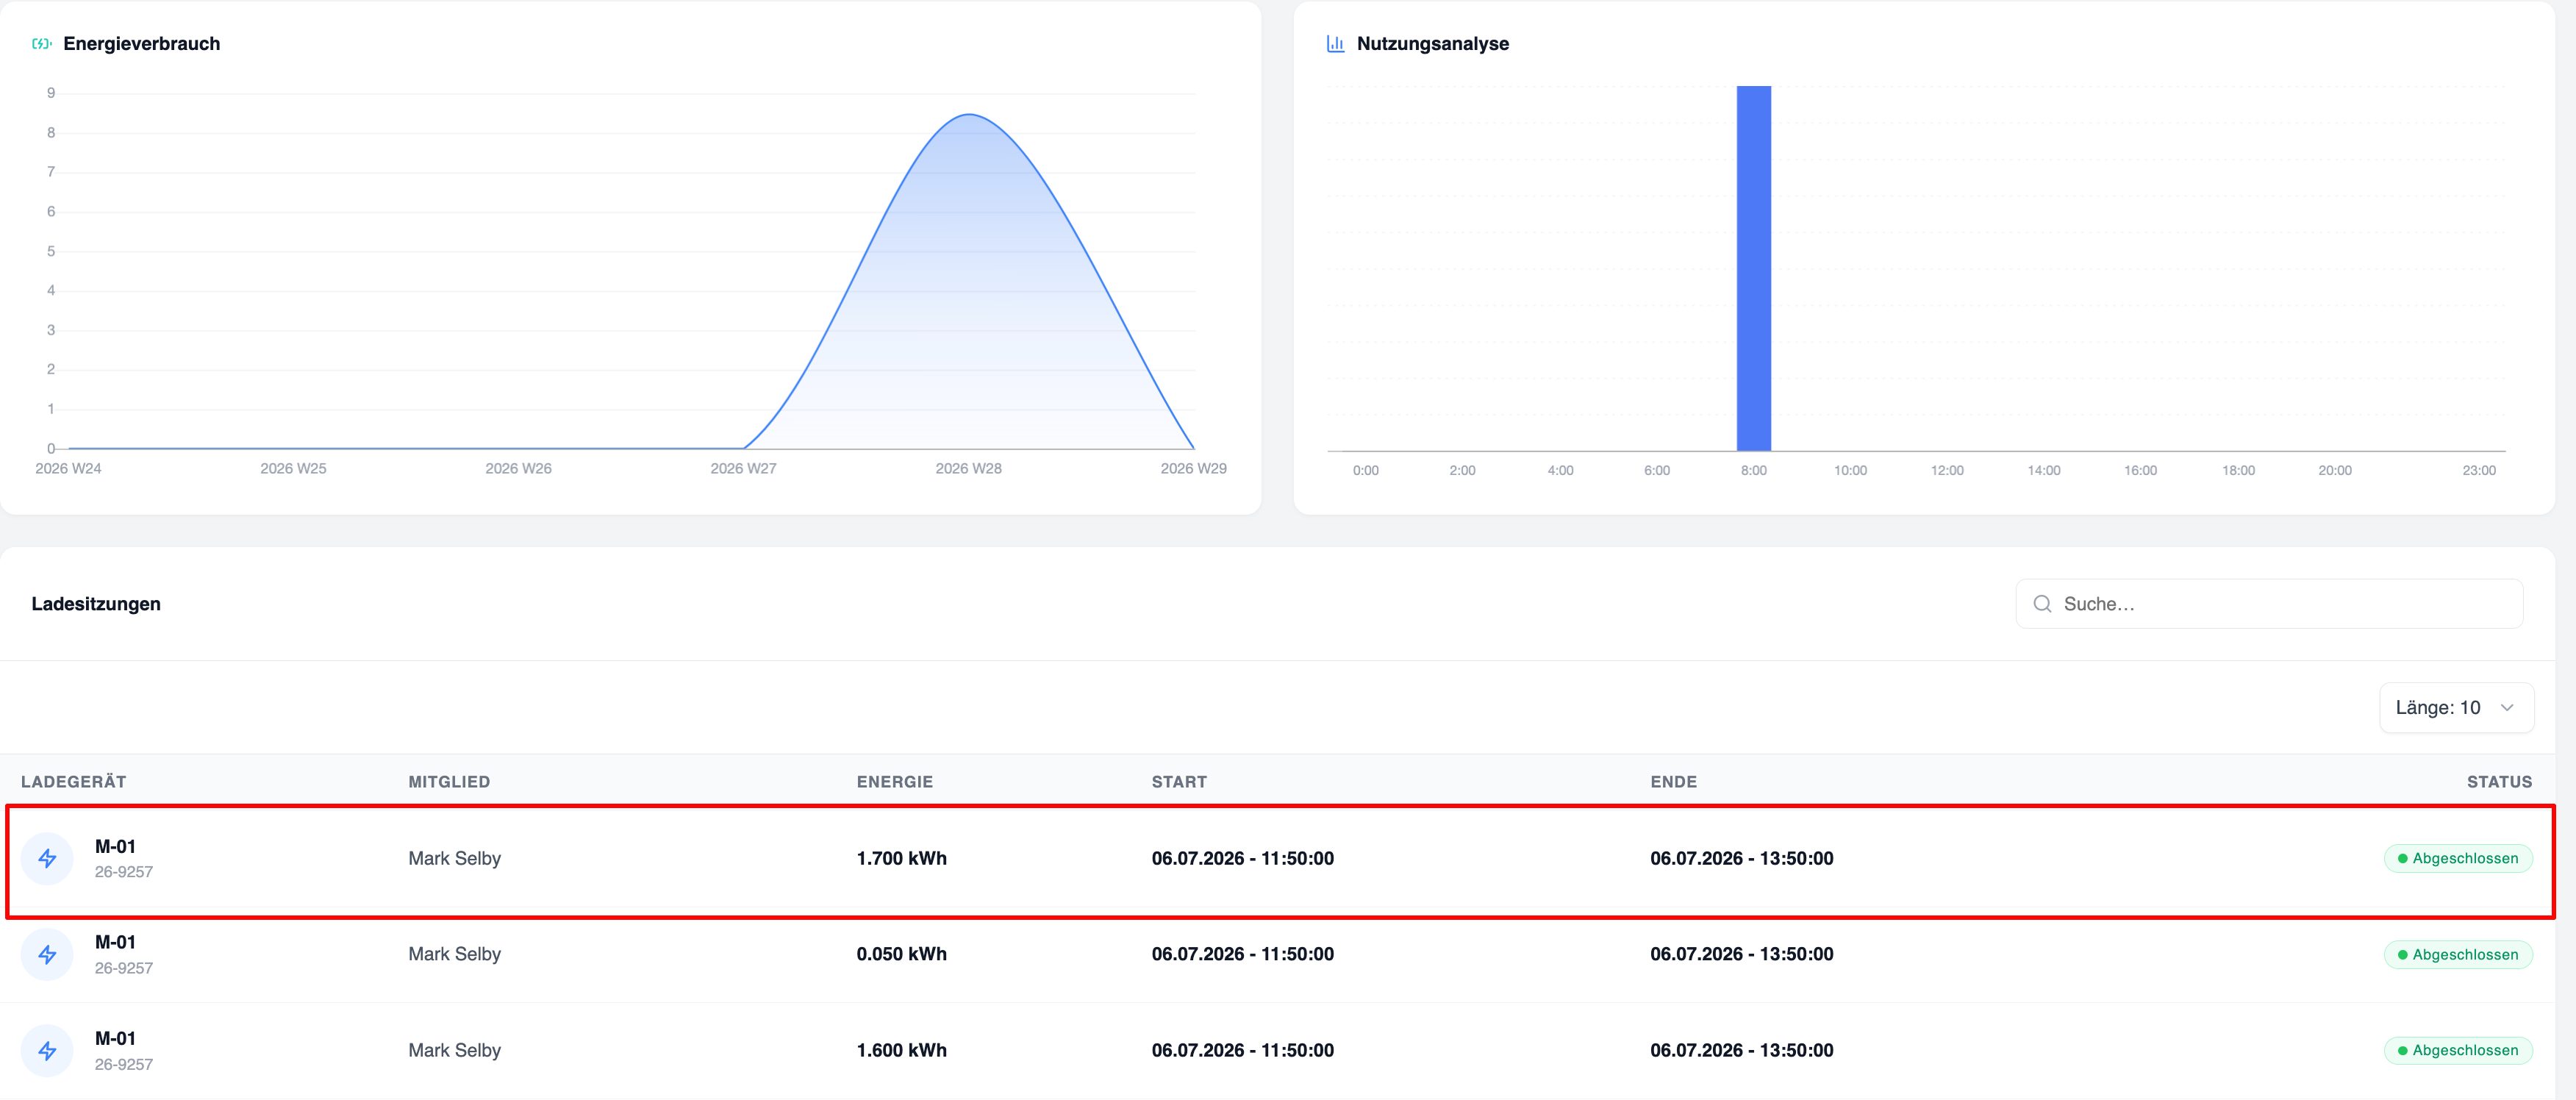
Search session history
The search function allows administrators to quickly find charging sessions.
You can search using the following criteria:
-
Member name
-
Name of the charger
This is particularly useful for customer support.
Member activity
The ‘Member Activity’ report helps administrators understand how members use the charging network.
Typical information includes:
-
Member’s name
-
Number of charging sessions
-
Total energy consumption
Common challenges
No data displayed
Possible causes include:
-
No charging sessions during the selected period.
-
Incorrect date range.
-
Insufficient permissions.
-
Chargers have not yet been assigned to the network.
Charging sessions are missing
Possible reasons include:
-
The sessions are hidden by filters.
-
The selected date range does not include the required charging sessions.
-
The charging sessions belong to a different charging network.