
Statistics – ‘Public Transactions’ page
Description
The ‘Public Charging Transactions’ page provides a complete overview of all charging sessions initiated by members of the public at charging points operated or managed via your Eponet account. These transactions are generated when an external electric vehicle driver starts a charging session at one of your publicly accessible charging points via the public payment process, for example by scanning a QR code or using a supported payment method.
This page is particularly useful for charging point operators (CPOs), property owners, local authorities, businesses and charging network operators who provide public charging services for electric vehicles and wish to understand how their public infrastructure is performing.
Navigation
To access the ‘Public Charging Transactions’ page:
-
Open the Eponet portal.
-
In the left-hand navigation menu, go to ‘Statistics’.
-
Under the ‘Statistics’ tabs, select ‘Public Charging Sessions’.
-
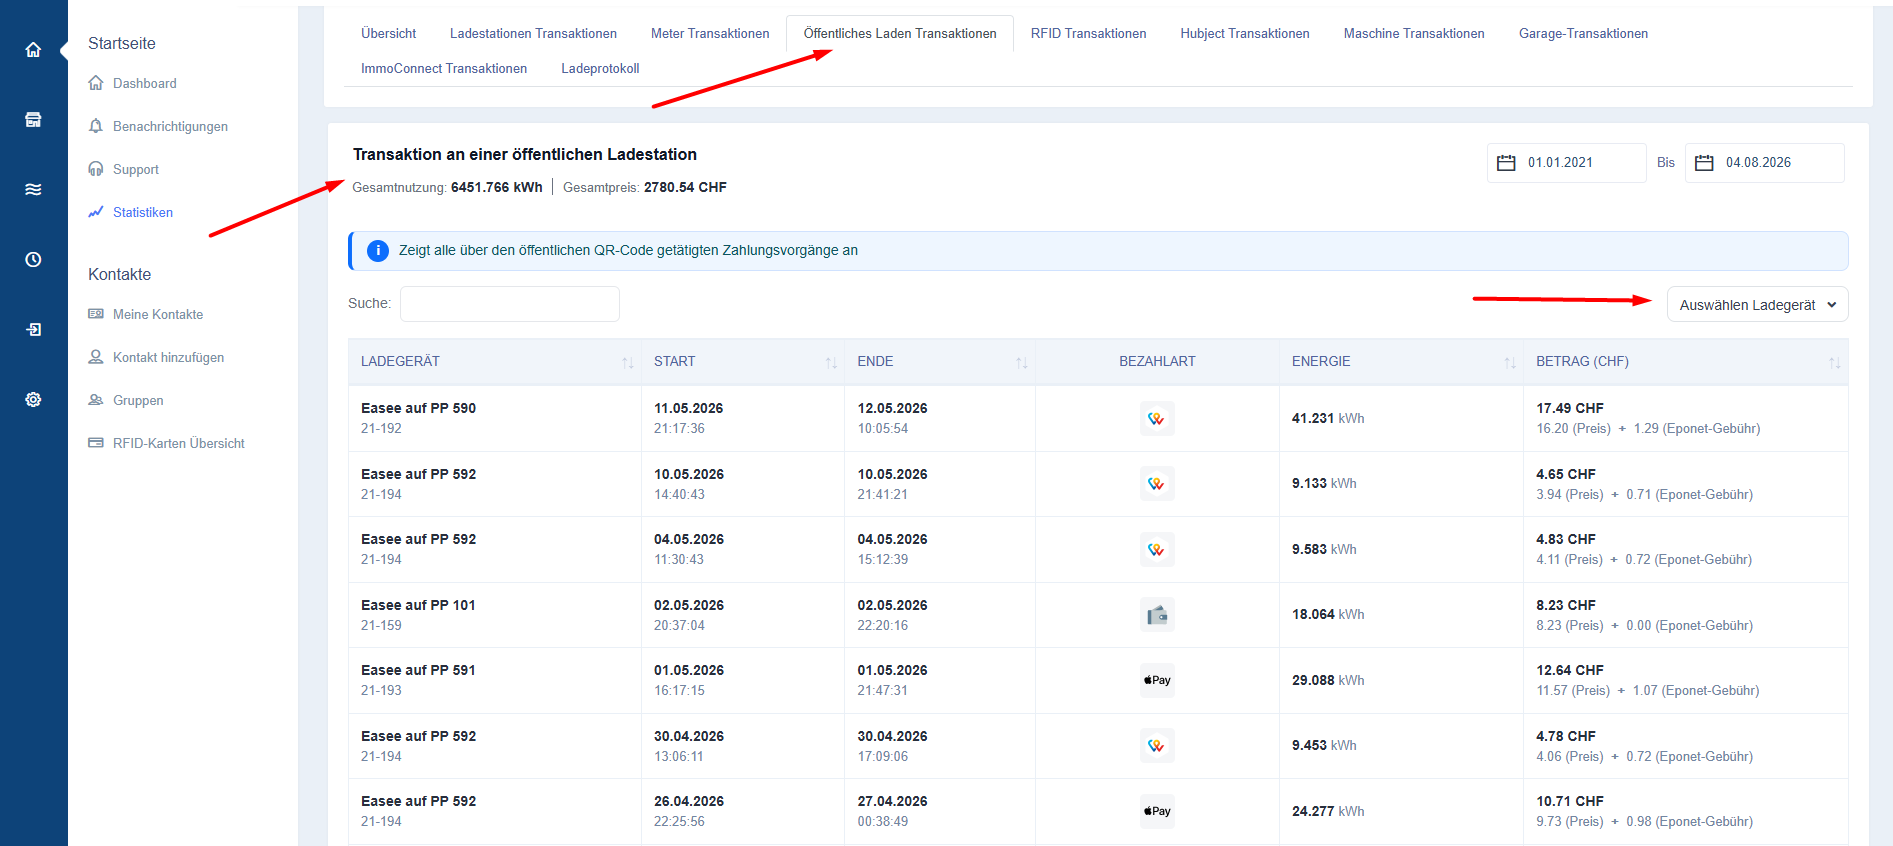
The page automatically displays all public charging transactions within the selected reporting period.
Purpose of the ‘Public Charging Transactions’ page
The ‘Public Charging Sessions’ page helps answer important business questions such as:
-
How many public charging sessions have been completed?
-
How much energy was supplied to public users?
-
What revenue was generated?
-
Which charging points are most frequently used by the public?
-
Which payment methods are used most frequently?
-
Which chargers generate the highest revenue?
Understanding the page layout
The page is divided into three main sections:
-
Overview header
-
Information banner
-
Detailed transaction report
Each section provides different levels of information, allowing users to switch from a general business overview to individual loading transactions.
Overview header
At the top of the page, an overview section displays the key performance indicators for all public charging transactions included in the selected reporting period.
The figures are updated automatically as soon as the filters or the reporting period change.
Total energy supplied
Shows the total amount of electricity supplied during public charging sessions.
The value is given in kilowatt-hours (kWh).
Every completed public charging session contributes to this total.
Total revenue
Shows the total revenue generated by all completed public charging sessions during the selected reporting period.
The calculated amount reflects the configured pricing model and may include the following:
-
Total
charging fees -
Eponet platform fees
Filtering data on public charging sessions
Several filters are available to help users quickly find specific charging sessions.
Whenever a filter is changed, both the summary values and the transaction report are automatically updated.
Date range
The date range selected determines which charging sessions are included in the report.
Selecting a different time period immediately recalculates the following values:
-
Total energy
-
Total revenue
-
Transaction list
Charger selection
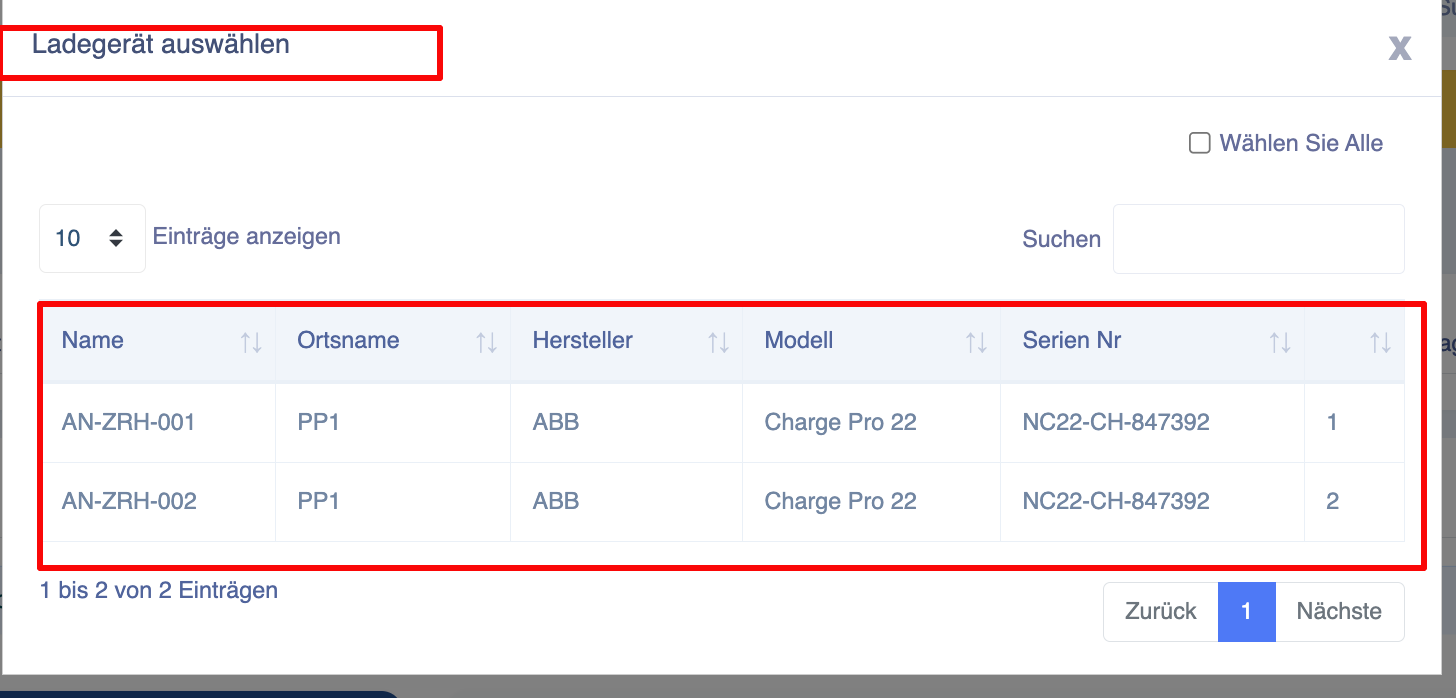
The ‘Select charging station’ filter allows users to view transactions for one or more charging stations.
The selection window supports:
-
Search
-
Multiple selection
-
Select all
Selecting multiple charging points combines all public charging sessions from the selected charging points into a single report.
Search
Users can quickly find specific charging sessions using the search field.
Users can search using the following information:
-
Charging point name
-
Charging point ID
-
Transaction ID
-
Payment reference (if available)
The transaction table is updated immediately once the search criteria are entered.
Explanation of the transaction report
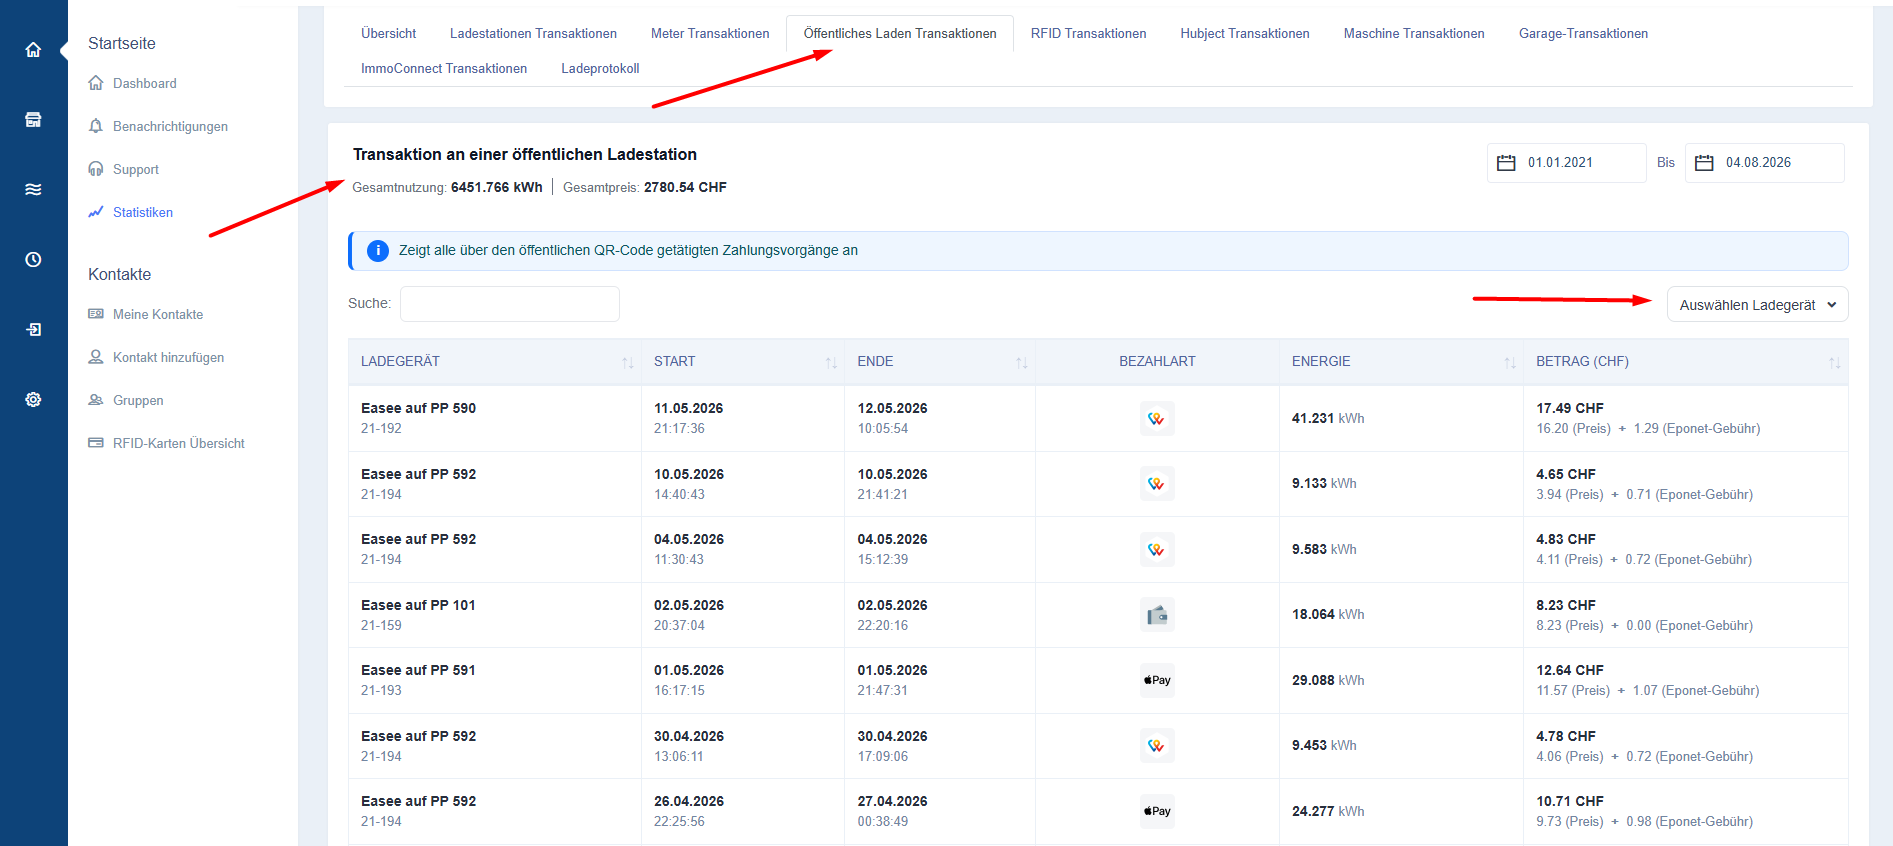
The detailed transaction report lists all completed public charging sessions that match the selected filters.
Each row represents a charging transaction.
The report contains all the information required for financial auditing, customer support and operational analysis.
Charging point
Displays the name of the charging point along with its unique charging point ID.
This enables operators to identify which charging point carried out the charging session.
Start time
Displays the exact date and time at which the charging session began.
End time
Displays the exact date and time at which the charging process ended.
Payment method
Shows how the customer paid for the charging session.
-
TWINT
-
Credit card
-
Debit card
-
Apple Pay
-
Google Pay
-
Other supported payment providers
This information helps merchants understand their customers’ payment preferences and reconcile payment records.
Energy supplied
Displays the amount of electricity supplied during the charging process.
The value is displayed in kWh.
Transaction amount
Shows the total amount charged for the completed charging session.
Depending on your pricing structure, this amount may be made up as follows:
-
Energy price
-
Session fee
-
Parking fee
-
Eponet service charge
The amount shown corresponds to the total value of the completed public charging transaction.
Totals
Two summary lines are displayed at the end of the report.
Page total
Calculates the totals only for the transactions currently visible on the active page.
Total
Displays the totals for all public billing transactions that match the selected filters, regardless of pagination.
This allows users to track the total revenue generated during the selected reporting period.
Exporting reports on public charging sessions
The ‘Public Charging Sessions’ page supports the export of filtered transaction reports.
Before exporting, users should check the following:
-
the selected reporting period
-
the selection of the charging point
-
the search filters applied
The exported report contains only those transactions that currently meet the selected criteria.