Statistics – ‘Counter Transactions’ page
Description
The ‘Meter Transactions’ page provides a comprehensive overview of all consumption data recorded by the meters linked to your Eponet account. Unlike the ‘Charging Transactions’ page, which focuses on electric vehicle charging, this page is designed to monitor the consumption of utilities such as electricity, water, gas, heating, air or other supported meter types.
The page enables users to analyse historical meter readings, compare the consumption of different appliances, identify consumption trends and export detailed reports for accounting, facility management or sustainability purposes.
Whether you manage a residential property, a commercial building, an industrial site or a mixed-use location, the ‘Meter Transactions’ page provides you with valuable insights into resource consumption for any reporting period.
Navigation
To access the ‘Meter Transactions’ page:
-
Open the Eponet portal.
-
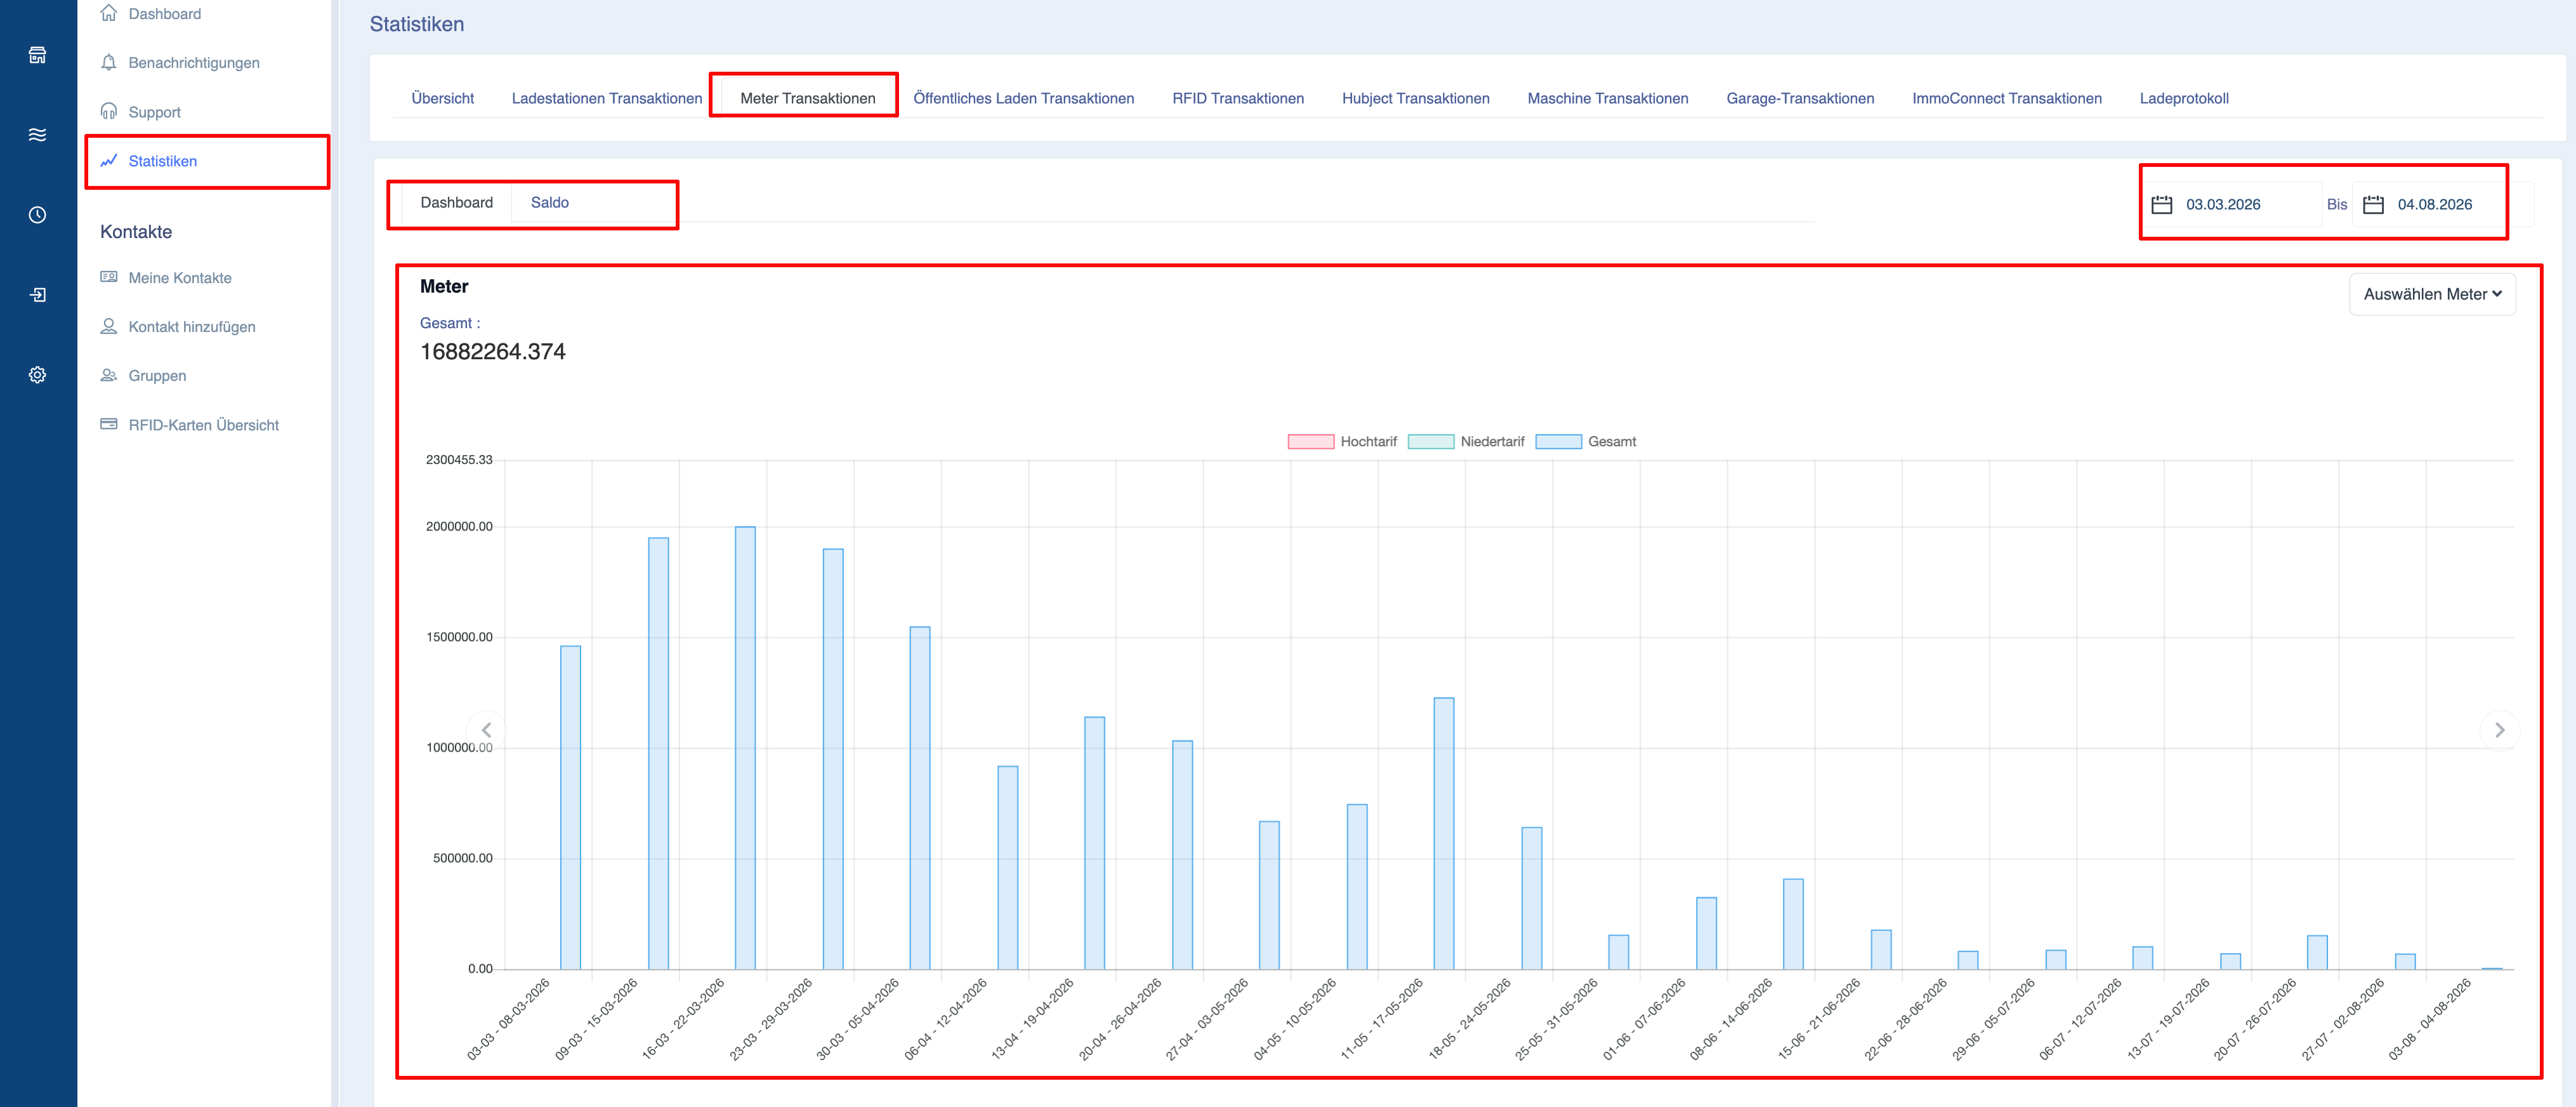
In the left-hand navigation menu, go to ‘Statistics’.
-
Under the ‘Statistics’ tabs, select ‘Meter Transactions’.
-
The page opens in the Dashboard view by default.
-
Switch between ‘Dashboard’ and ‘Balance’ (Detailed Report) depending on the level of detail you require.
Purpose of the ‘Meter Transactions’ page
The ‘Meter Transactions’ page is designed to help users answer key operational questions, such as:
-
How much electricity was consumed during the selected period?
-
Which meters show the highest consumption?
-
How does consumption change over time?
Unlike charging processes, meter data is continuously recorded by the installed metering devices and compiled into informative reports.
Understanding the page layout
The page consists of two main sections:
-
Dashboard
-
Balance (Detailed Report)
The Dashboard displays visual overviews and graphs, whilst the ‘Balance’ tab provides a detailed breakdown of consumption for each selected meter.
Dashboard
The Dashboard offers a visual summary of all selected meter data.
Instead of listing individual meter readings, it displays aggregated consumption figures and graphical trends, enabling users to monitor resource usage at a glance.
The dashboard updates automatically whenever filters or date ranges are changed.
Total Consumption
The main overview chart displays the total consumption recorded by the selected meters during the chosen reporting period.
The value displayed depends on the type of meter selected.
Examples of this include:
-
Electricity → kWh
-
Water → m³
-
Gas → m³
-
Heat → kWh
-
Air flow rate → m³/h
If several meter types are selected, the dashboard displays the corresponding values in accordance with the system configuration.
Consumption chart
The dashboard includes a graphical representation of consumption over time.
Depending on the selected reporting period, the chart automatically groups the data.
This visualisation helps users to identify the following:
-
Daily consumption patterns
-
Weekly trends
-
Seasonal fluctuations in consumption
-
Unexpected spikes
-
Periods of unusually low activity
Selection of meters
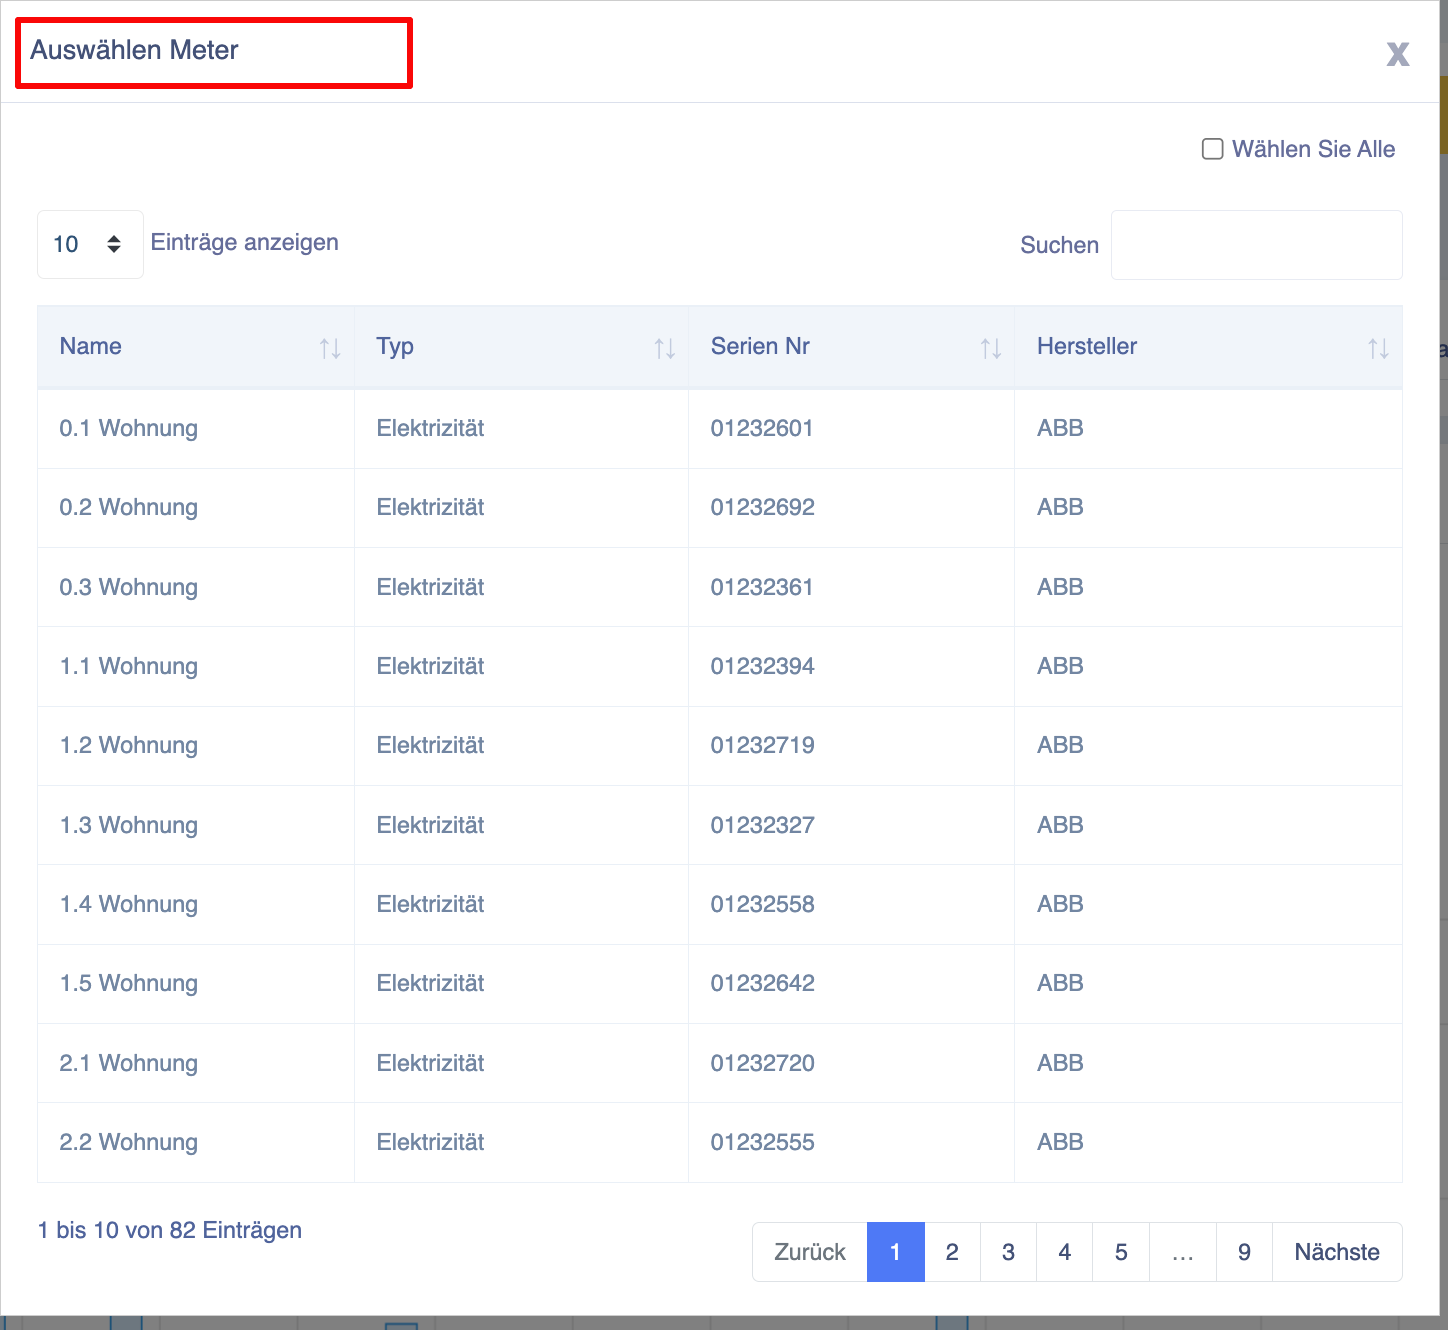
Users can view statistics for specific meters by clicking the ‘Select Meter’ button.
Useful identification details are displayed for each meter, such as:
-
Meter name
-
Meter type
-
Serial number
Users can:
-
Select a single meter
-
Select multiple meters
-
Search by meter name
-
Select all available meters
If several meters are selected, their consumption figures are summarised in the dashboard and in the report.
Benefits of the dashboard
The dashboard provides a quick overview without users having to check each recorded meter reading individually.
Typical use cases include:
-
Monthly energy analyses
-
Consumption monitoring
-
Analysis of supply costs
Balance (Detailed Report)
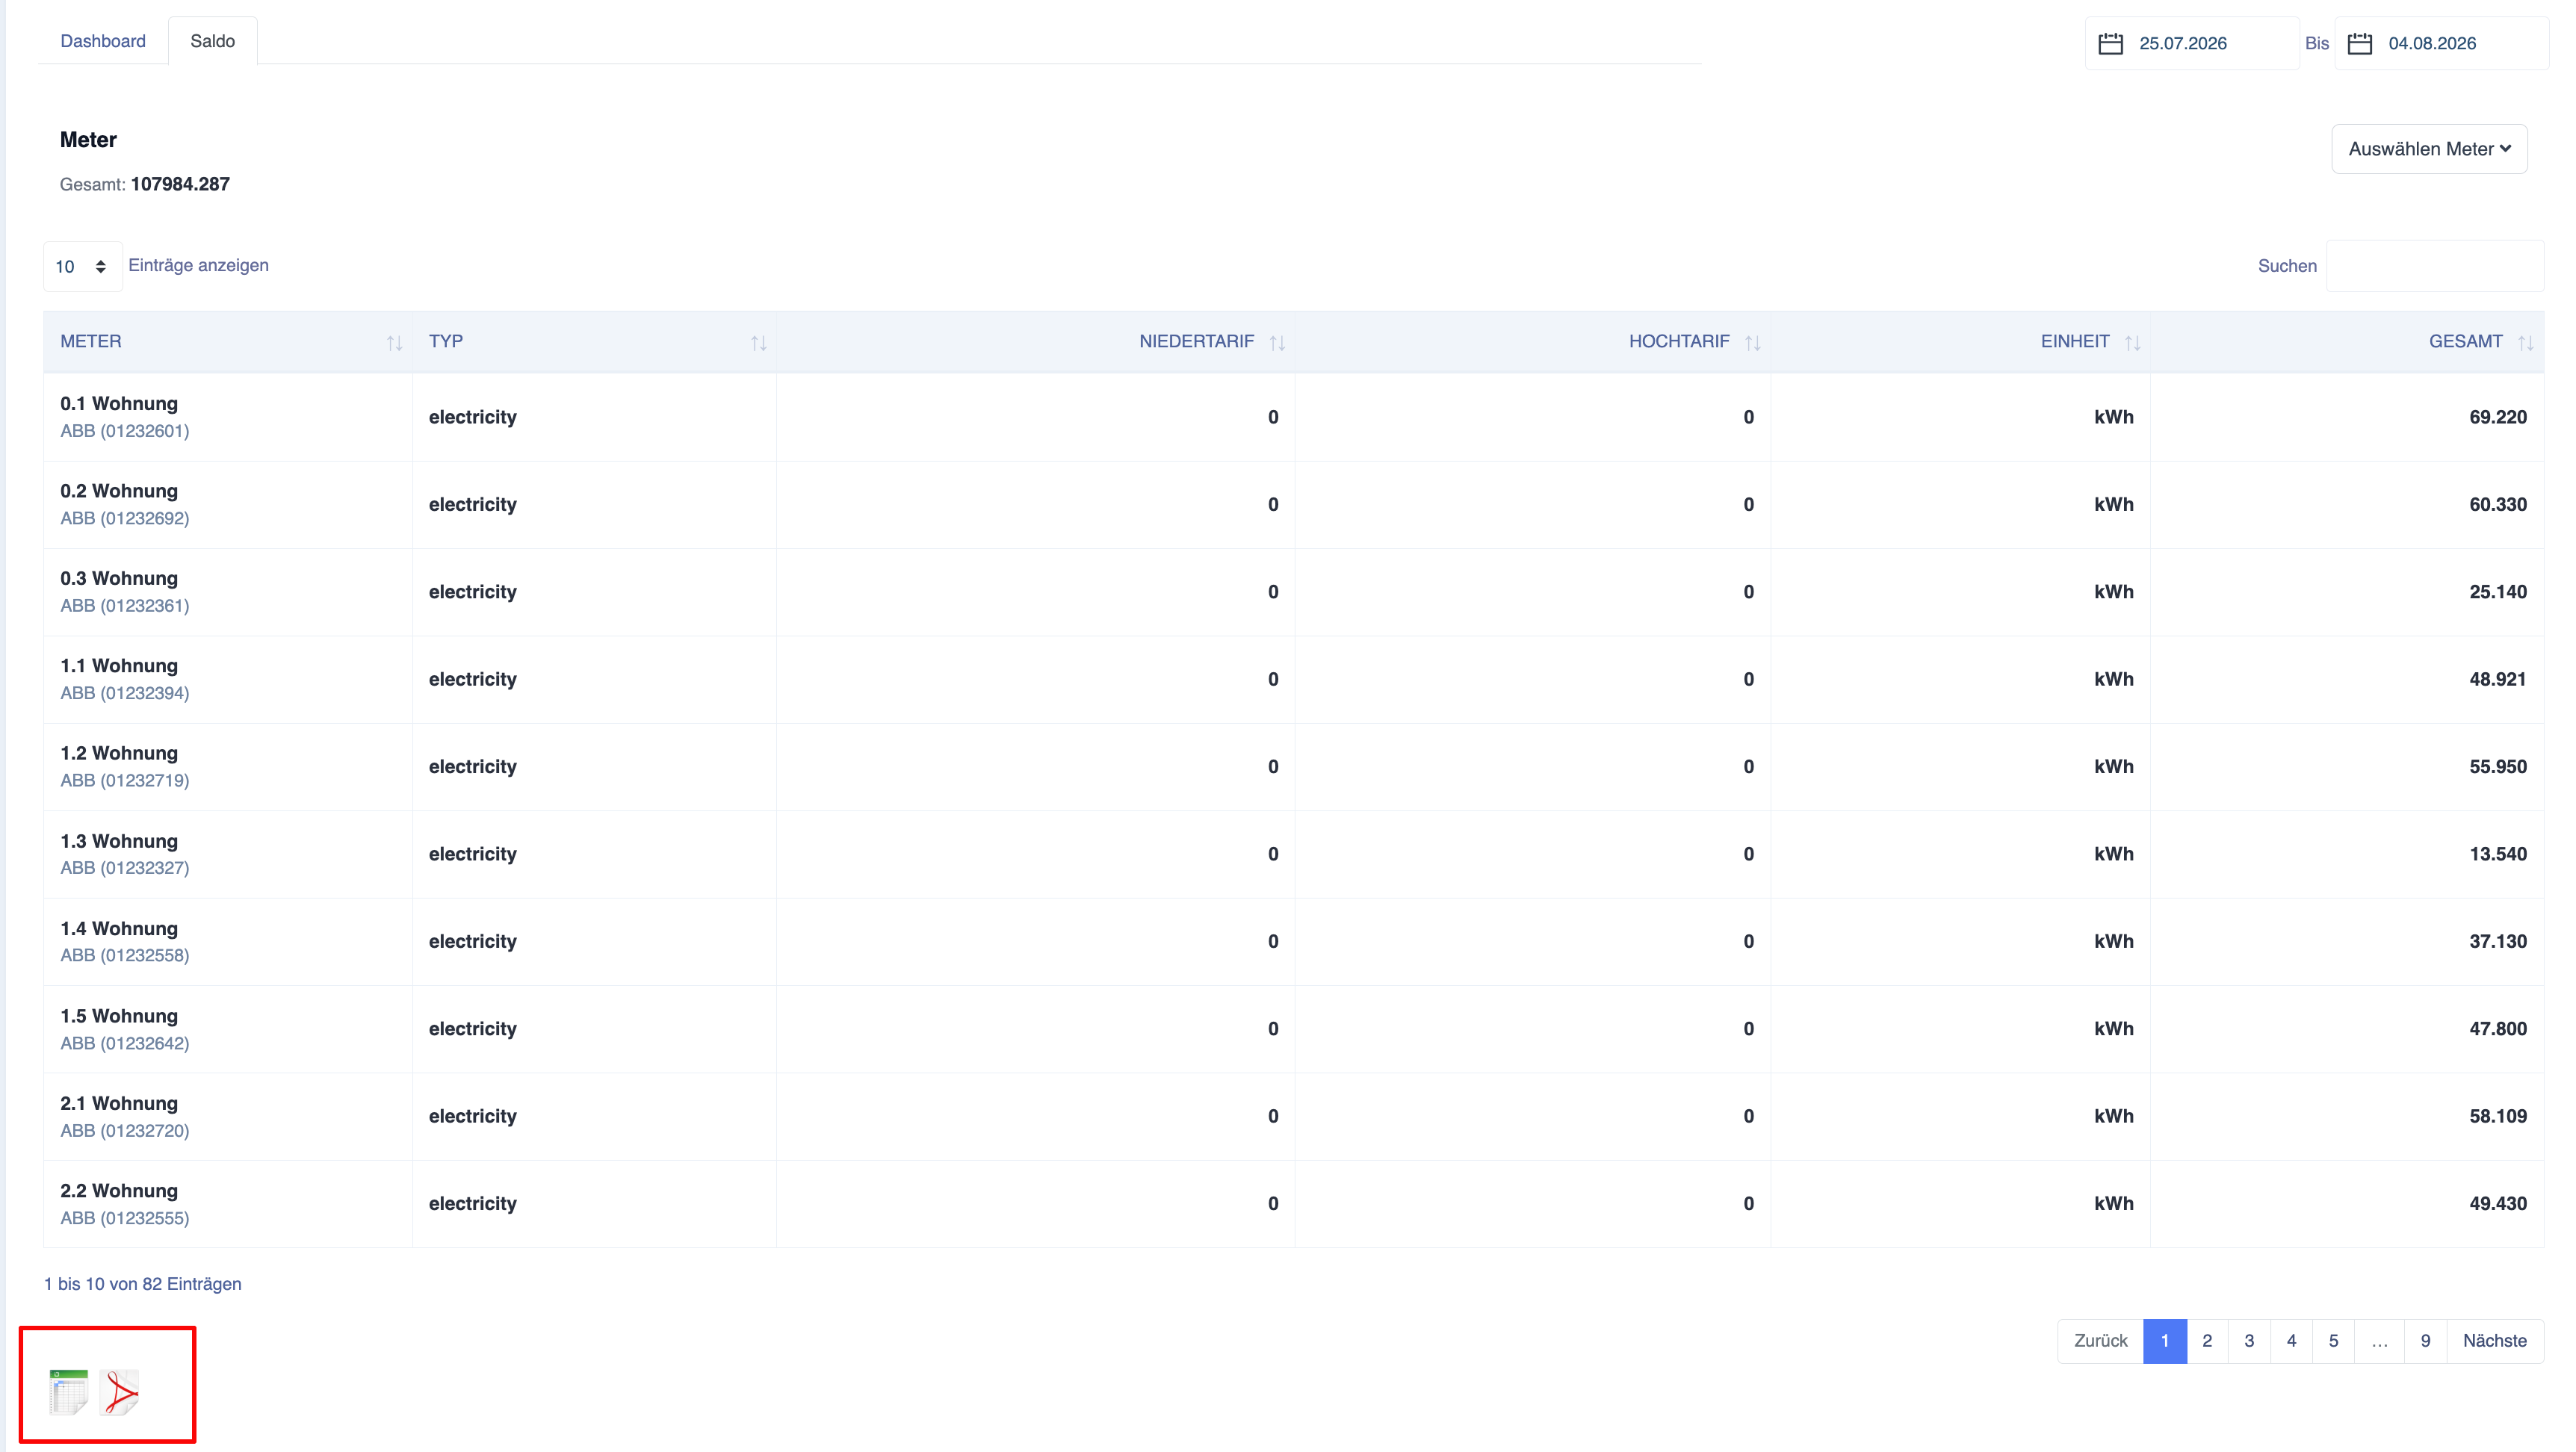
The ‘Balance’ tab displays a detailed report showing the consumption figures for each selected meter.
Unlike the dashboard, which focuses on visual overviews, the Balance report provides precise numerical information that can be reviewed, compared or exported.
Explanation of the report
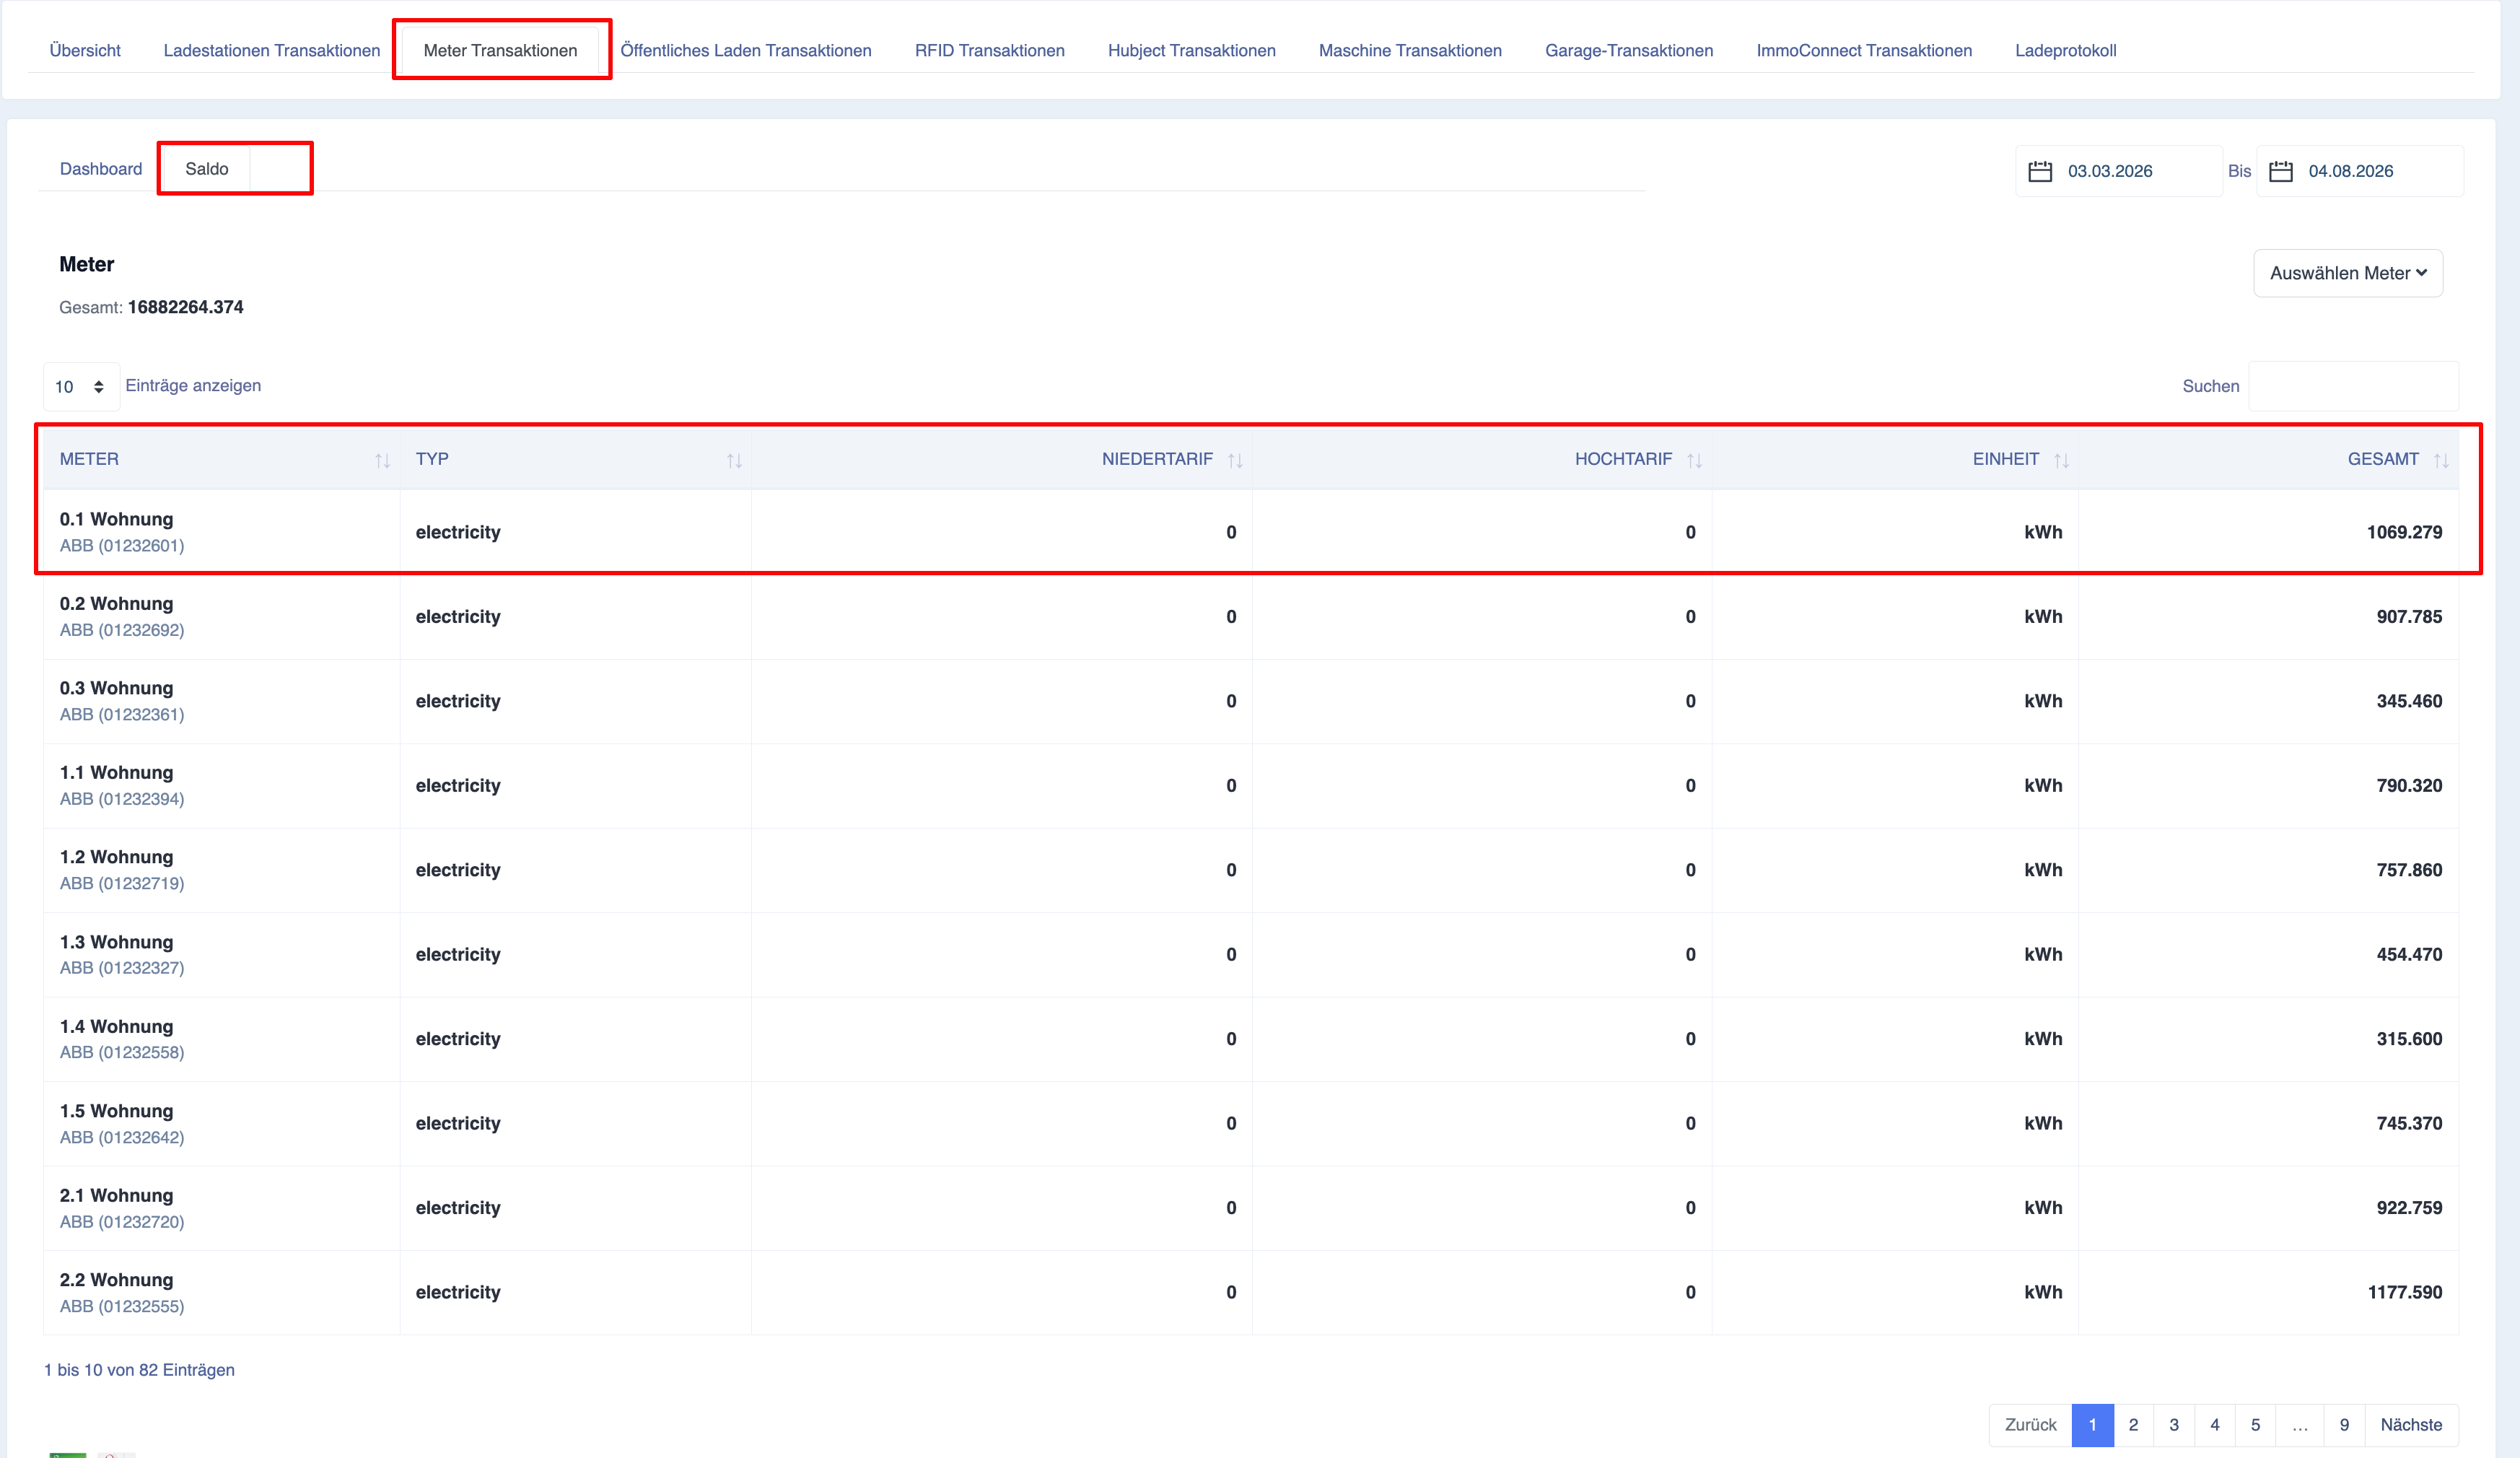
Each row in the report represents a meter that matches the selected filters.
Typical columns include:
Meter
Displays the name of the meter along with its unique identifier.
This helps to distinguish between multiple meters installed in different buildings or at different locations.
Type
Specifies the type of energy measured by the meter.
Examples include:
-
Electricity
-
Water
-
Gas
-
Heating
-
Air
To interpret the reported units, it is important to know the meter type.
Unit
Displays the unit of measurement used by the selected meter.
Common units include:
-
kWh
-
m³
-
litres
-
Hours
-
Units defined by the connected device
This ensures that users interpret the reported consumption correctly.
Total consumption
Displays the measured total consumption for the selected reporting period.
This value is calculated automatically based on the meter data recorded.
Totals
Two summary values are displayed at the end of the report.
Page total
Displays only the totals for the currently visible report page.
This value changes when you switch between report pages.
Total
Displays the totals for all selected counters that match the current filters.
Unlike the ‘Page total’, this value covers all report pages.
Exporting meter reading reports
The ‘Meter Transactions’ page supports the export of filtered consumption reports.
Before exporting, users should check the following:
-
Date range
-
Selected meters
-
Meter types
-
Filters applied
Only the data currently filtered will be included in the exported report.