
Statistics – ImmoConnect transactions
Description
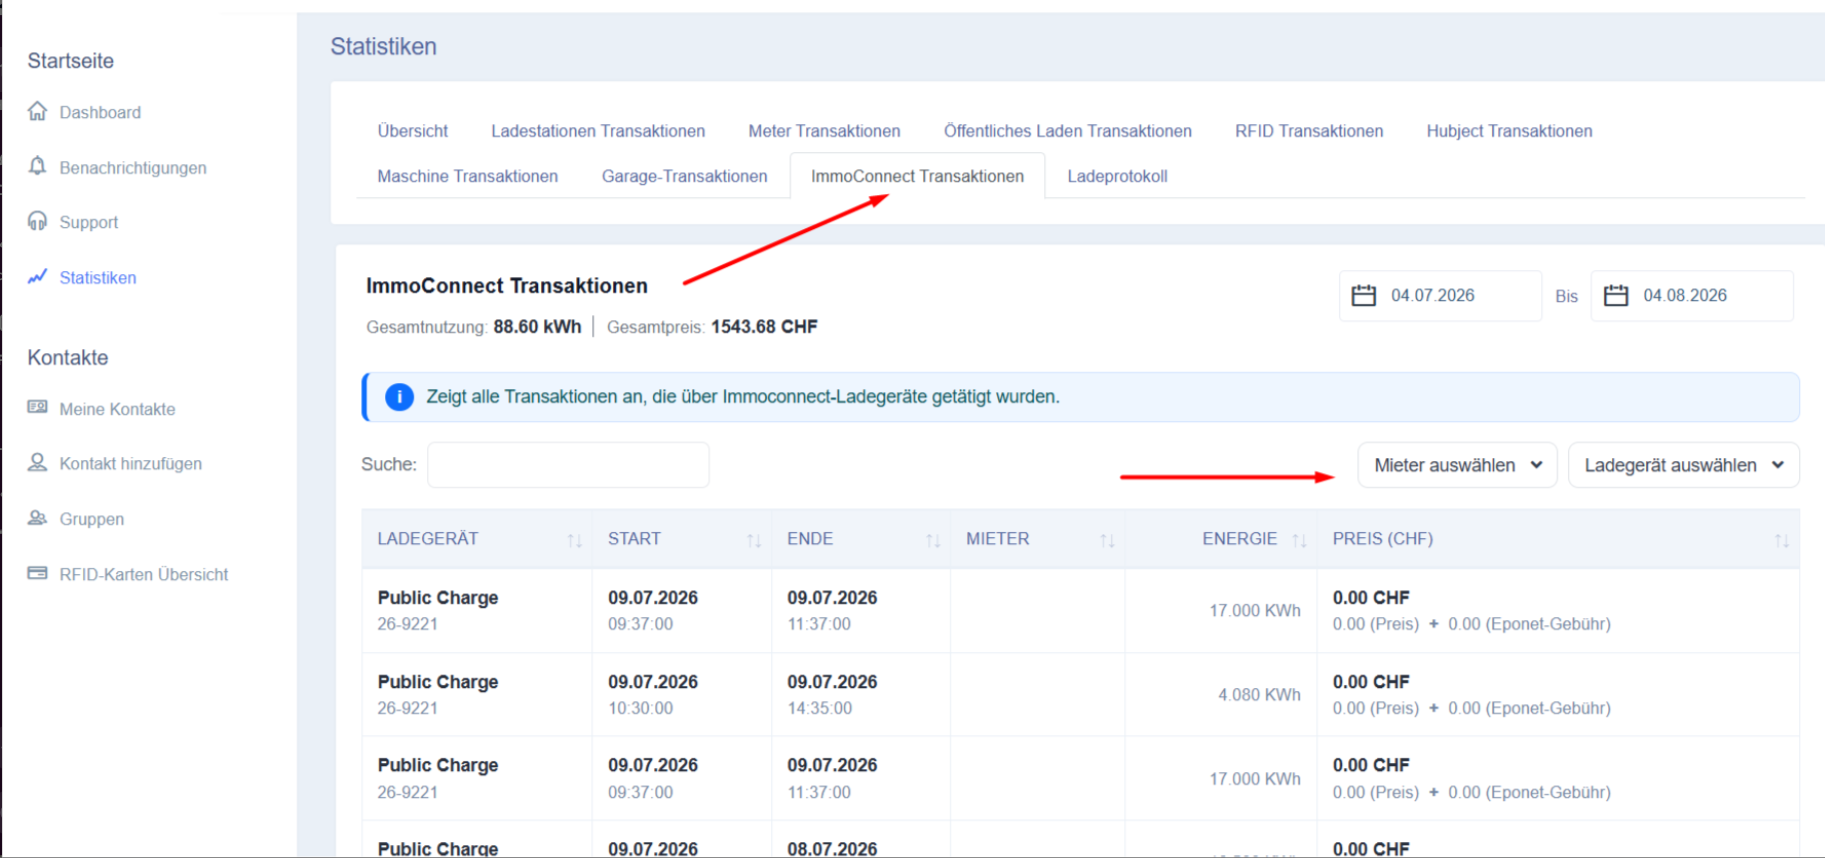
The ‘ImmoConnect Transactions’ page provides a complete overview of all charging operations carried out via chargers configured for ImmoConnect. This page has been specifically designed for residential and commercial properties where the charging of electric vehicles is linked to tenants, flats, offices or managed properties.
Unlike the standard ‘Charging Point Transactions’ page, which displays all charging sessions regardless of the owner, the ‘ImmoConnect Transactions’ page focuses on charging sessions associated with tenants and managed properties. This enables property owners and managers to easily monitor charging activity, analyse energy consumption and generate tenant-specific reports or billing information.
The page is particularly useful for property managers, housing associations, commercial property managers and facility management companies that operate a shared charging infrastructure for multiple tenants.
All information displayed on this page is updated automatically as soon as filters or the selected reporting period are changed.
Navigation
To access the ‘ImmoConnect Transactions’ page:
-
Open the Eponet portal.
-
Select ‘Statistics’ from the navigation menu on the left-hand side.
-
From the available statistics tabs, click on ‘ImmoConnect Transactions’.
-
The page displays all ImmoConnect settlement transactions for the selected reporting period.
Highlights:
Purpose of the ImmoConnect ‘Transactions’ page
The ‘Transactions’ page on ImmoConnect helps owners/managers to review key operational and billing data, including:
-
How much energy has each tenant consumed?
-
Which charging costs should be allocated to individual tenants?
-
Which charging points are used most frequently within the property?
-
How many charging sessions took place during the selected period?
Rather than looking at all charging sessions collectively, administrators can use this page to focus specifically on charging activities in ImmoConnect-enabled properties.
Overview information
At the top of the page, overview charts display key statistics on all ImmoConnect charging sessions within the selected reporting period.
These figures are updated automatically as soon as filters are changed.
Total charging costs
Displays the total charging costs for all tenants’ charging sessions.
Depending on your pricing structure, this amount may include the following:
-
Energy costs
-
Charges for charging sessions
-
Configured service charges
This information provides a quick overview of tenants’ charging costs before you view detailed reports.
Information banner
Below the overview section, an information banner explains the scope of the data displayed.
The ‘ImmoConnect Transactions’ page displays only charging sessions associated with ImmoConnect-enabled chargers and tenants.
Charging sessions at public charging points, in garage mode, via Hubject roaming or from standard charging point reports are not included here.
This separation enables the creation of tenant-specific reports without having to manually filter out charging data from other environments.
Date range
The selection of the date range determines which charging sessions are included in the report.
Users can select any custom date range
Changing the date automatically updates the following values:
-
Total energy
-
Total costs
-
Transaction report
Tenant selection
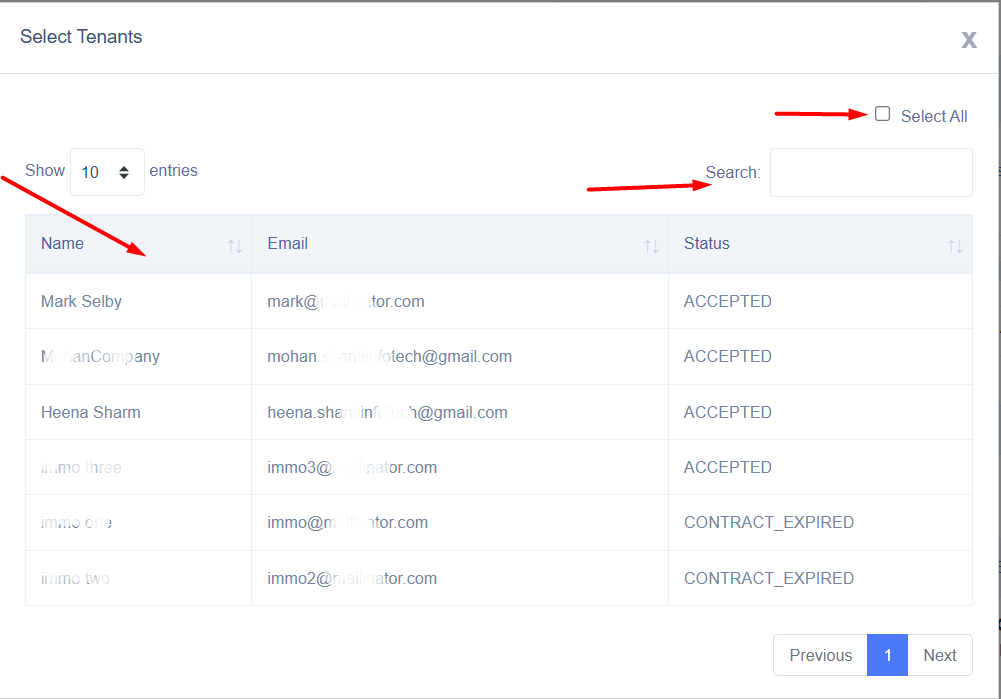
Using the ‘Select tenant’ filter, users can view top-up transactions for one or more tenants.
Users can:
-
Search by tenant name
-
select a single tenant
-
Select multiple tenants
-
Select all tenants
This makes it easier to generate billing reports for individual residents or to compare billing activities across multiple tenants.
Selecting charging points
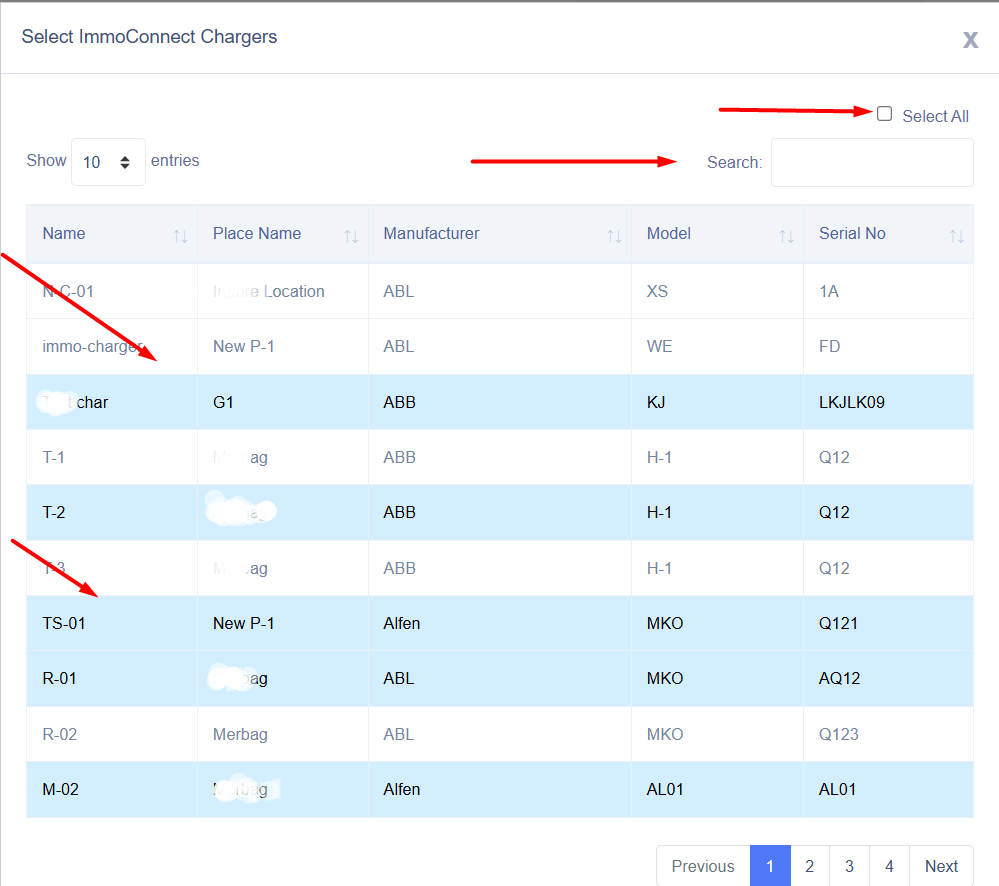
Using the ‘Select charging station’ filter, administrators can restrict the report to one or more charging stations.
This is useful if a building has several charging points or parking areas.
The selection window supports:
-
Search
-
Multiple selection
-
Select all
Search
Users can quickly find specific loading processes using the search field.
Users can search using the following criteria:
-
Charger name
-
Charger ID
The report is updated immediately as soon as search criteria are entered.
Start time
Displays the exact date and time when the charging process began.
End time
Shows the exact date and time when the charging process ended.
By combining the start time and end time, users can work out the duration of the charging process.
Energy supplied
Displays the amount of electricity supplied during the charging process.
The value is displayed in kilowatt-hours (kWh).
Charging costs
Shows the calculated charging costs for the completed charging session, depending on your pricing configuration.
Totals
Two summary lines are displayed at the end of the report.
Page total
Displays only the totals for the billing sessions currently visible on the active page.
Total
Displays the totals for all ImmoConnect load operations that match the selected filters, regardless of pagination.