
Statistics – Chargers’ transactions
Description
The ‘Charging Sessions’ page provides a complete overview of all charging sessions that have taken place at the chargers assigned to your account. It is the central hub for analysing charging activity, monitoring energy consumption, reviewing charging costs and exporting charging data for billing or reporting purposes.
Unlike the ‘Overview’ page, which displays aggregated statistics for all devices, the ‘Charging Station Transactions’ page focuses exclusively on charging sessions. Each charging session is recorded individually, allowing users to view detailed information such as the charging point used, the RFID card used for authorisation, the duration of the charging session, the energy supplied and the calculated charging costs.
Navigation
Statistics → Charging Point Transactions
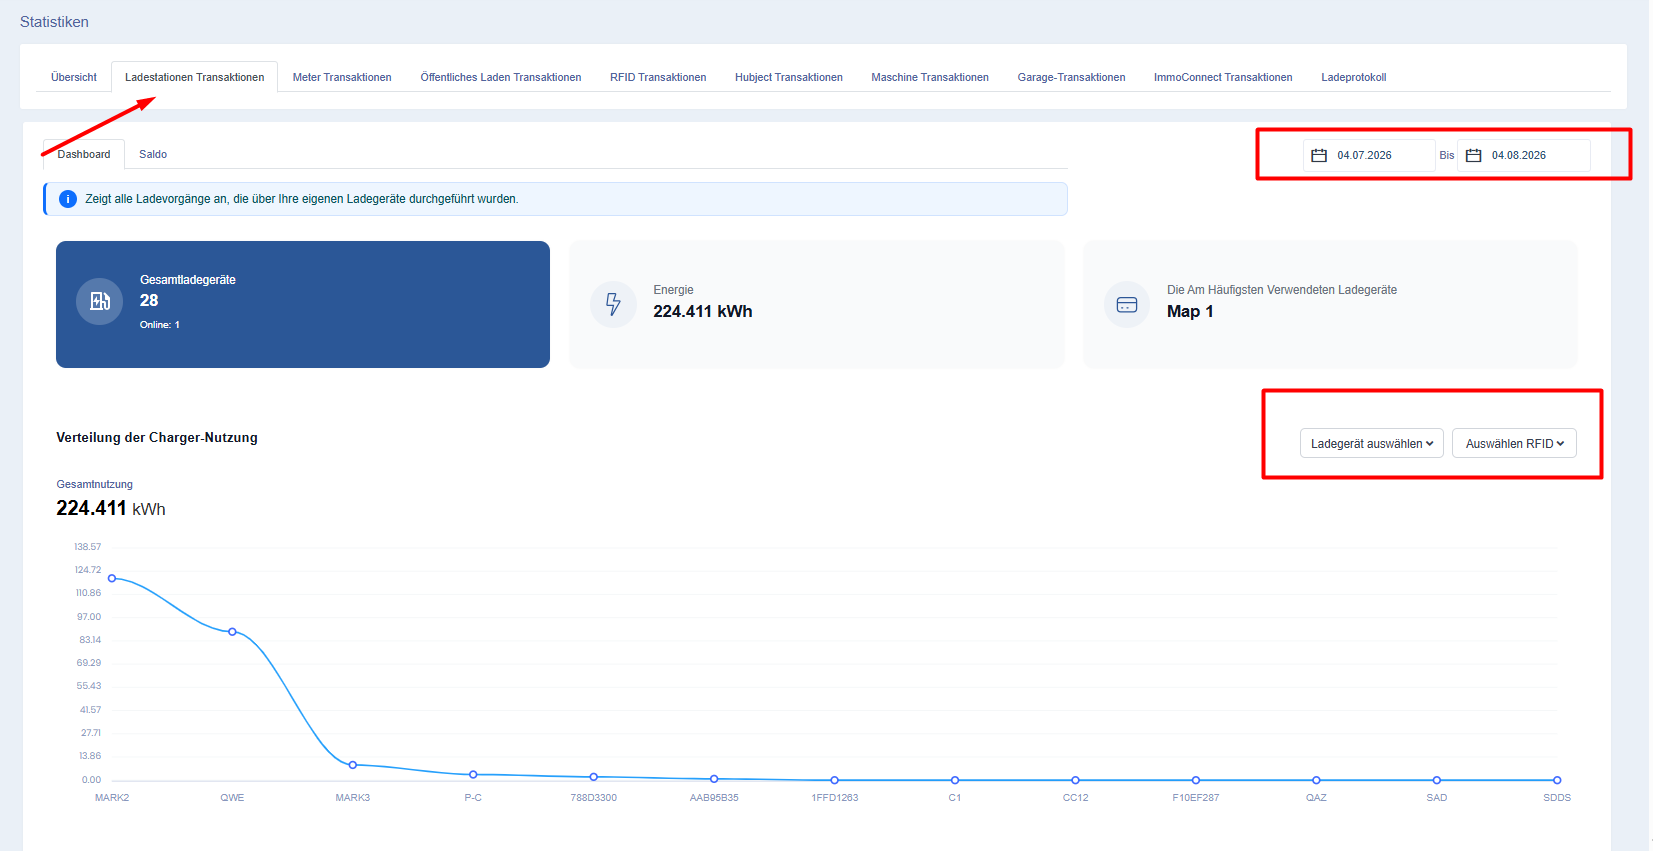
Once the page is open, the date range (the last 30 days) is automatically applied and the dashboard view is displayed.
Understanding the page
The ‘Charger Transactions’ page consists of two main sections.
- Dashboard
- Balance (Detailed Report)
Both sections display the same underlying charging data, but present it differently depending on whether the user wants a visual overview or a detailed transaction report.
Dashboard
The dashboard provides a graphical overview of charging activity over the selected time period.
Rather than displaying each charging session individually, the dashboard summarises key information in charts and overview maps, allowing users to quickly assess the performance of the chargers.
The dashboard is updated automatically as soon as filters or date ranges are changed.
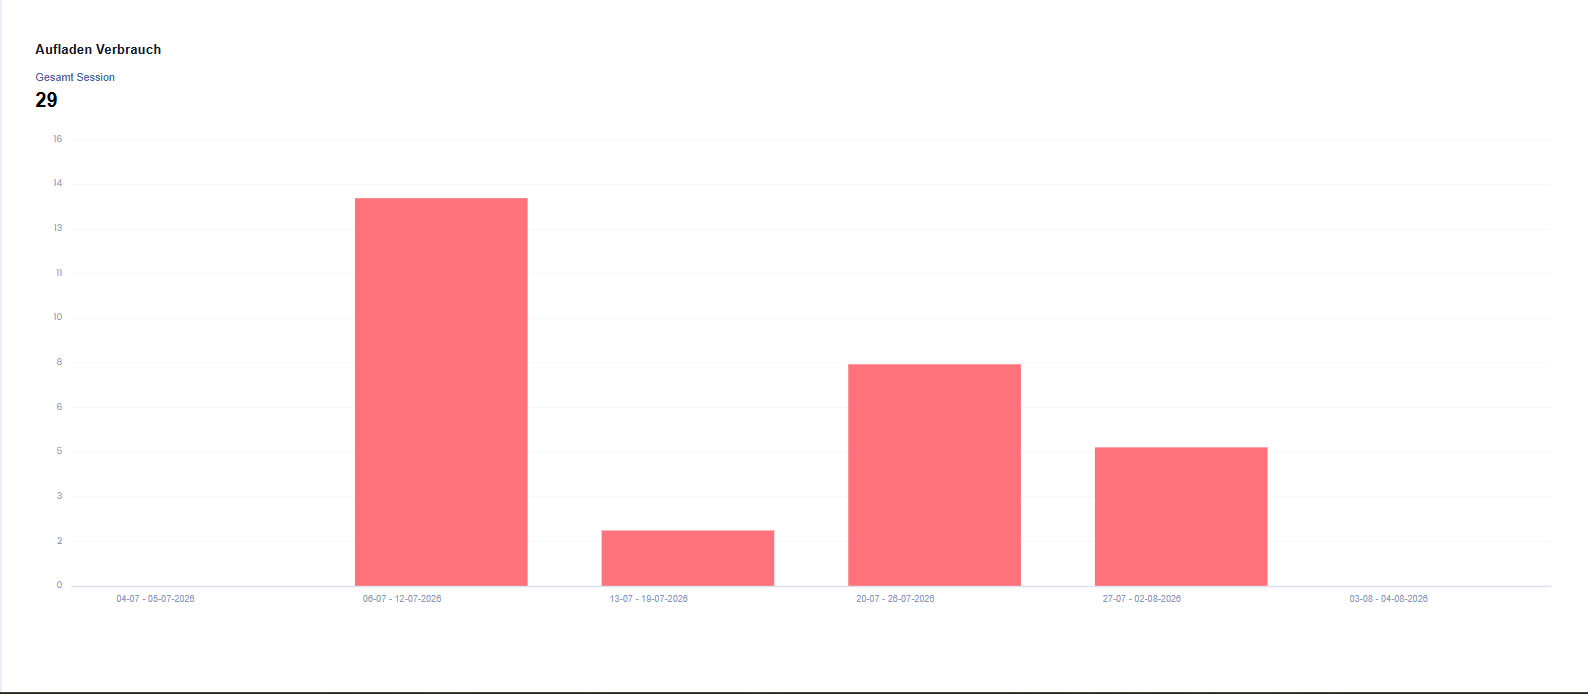
Overview charts
In the upper section of the dashboard, several overview charts display key information.
- Total number of chargers:
- Chargers online: Shows how many chargers are currently communicating with the Eponet platform
Total electricity supplied
Shows the total amount of electricity supplied during the selected time period.
The value is displayed in kWh.
Every completed charging session contributes to this total.
Total number of charging sessions
Shows the total number of completed charging sessions included in the selected time period.
Incomplete or ongoing charging sessions are not displayed.
Most frequently used charging point
The dashboard also highlights the charging point with the highest frequency of use during the selected time period.
The calculation is based on the total energy supplied.
This enables administrators to identify which chargers are in the highest demand.
Filtering charger data
The dashboard supports various filters.
As soon as a filter is applied, all overview maps, charts and reports are automatically updated.
Date range
The date range selector is located in the top right-hand corner.
Users can specify the following
- Start date
- End date
Only charging sessions within the selected time period will be included in the report.
Selecting a charger
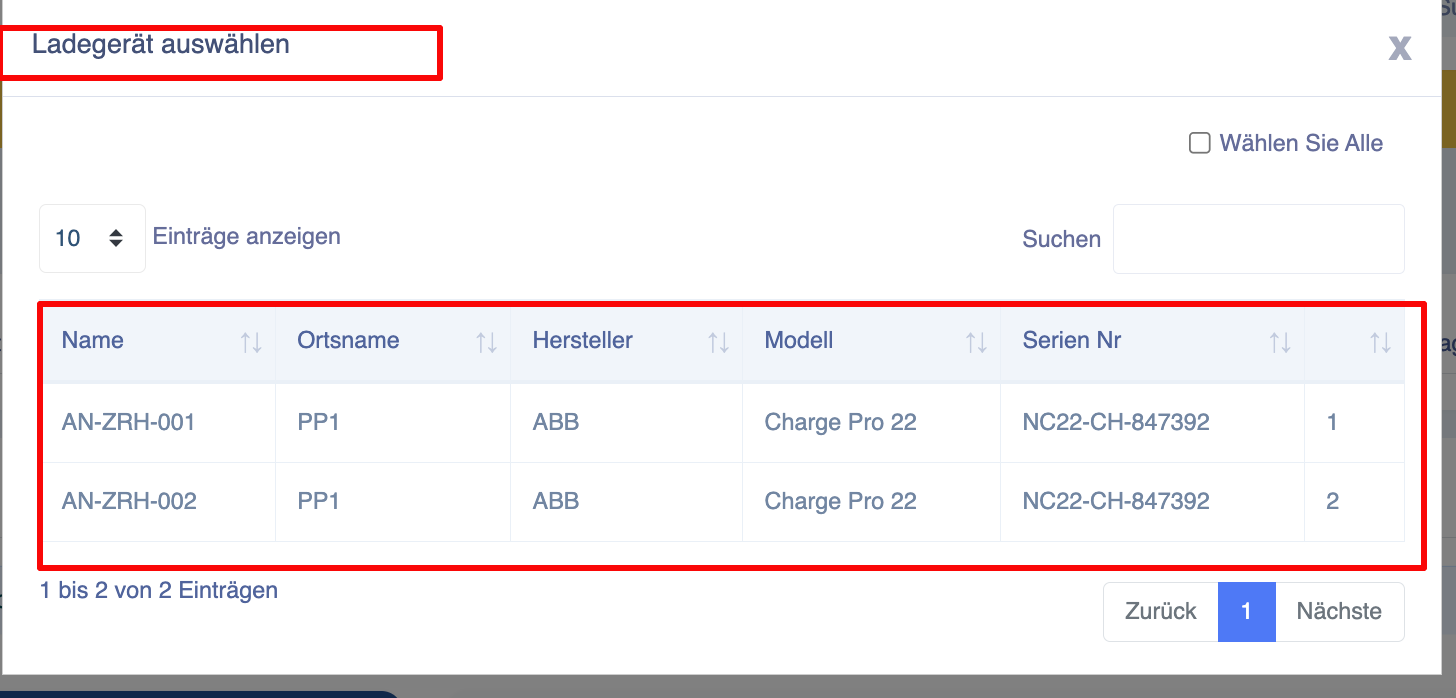
If you select ‘Select charger’, a dialogue box opens showing all chargers available to the user.
The list supports
- Search
- Multiple selection
- Select all
If several chargers are selected, the statistics for all selected chargers are summarised in a single report.
RFID filter
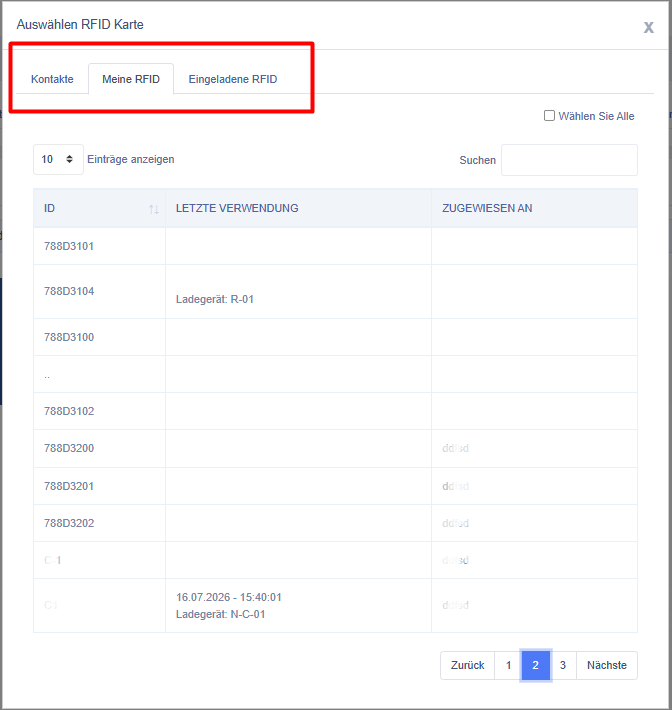
The RFID filter allows users to view only those charging sessions that were initiated using selected RFID cards.
This is particularly useful when analysing the charging behaviour of individual staff members, departments or visitors.
Example
A company wishes to review charging sessions carried out exclusively using the ‘Fleet Vehicles’ RFID cards.
Selecting these cards updates the following
- Dashboard
- Chart
- Card summary
- Detailed report
Search
Users can quickly find charging sessions using the search field.
The search function supports criteria such as
- Charger name
- Charger ID
- RFID number
The results are filtered immediately.
Balance (Detailed Report)
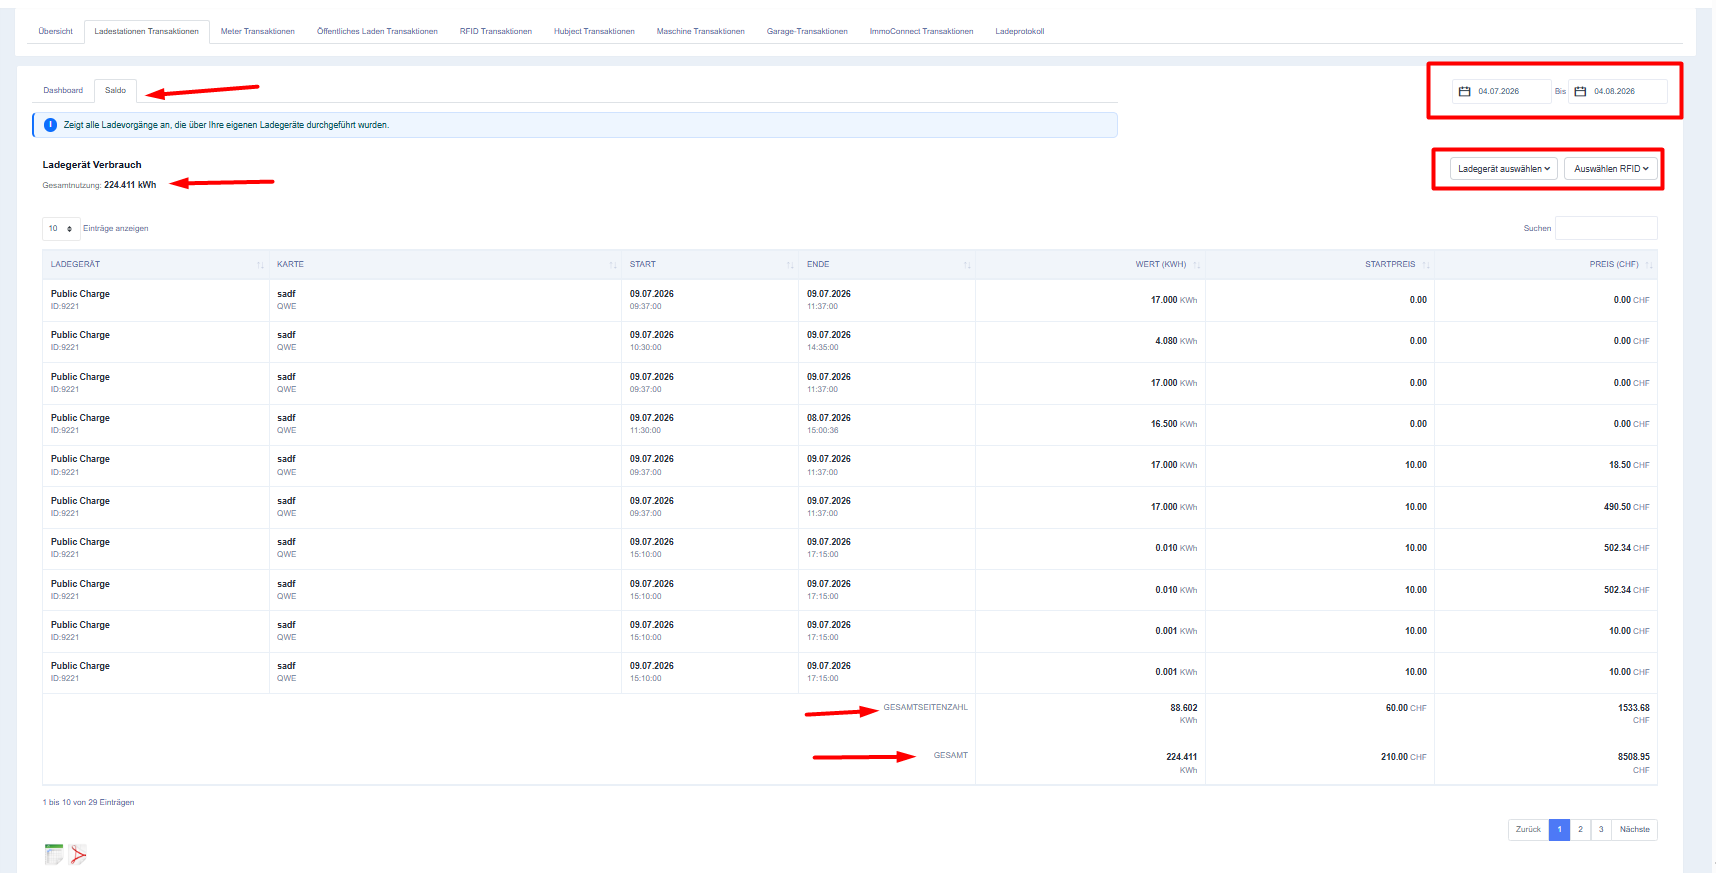
The ‘Balance’ tab provides a complete transaction report containing all charging transactions that match the selected filters.
Each row represents a completed charging transaction.
Unlike the dashboard, which focuses on trends, the Balance report provides details at transaction level.
Understanding the report
Each row contains detailed information about a top-up transaction.
Typical columns include:
Charger
Displays the name and ID of the charger.
This helps to distinguish between chargers installed at different locations.
RFID card
Displays the RFID card used to authorise the charging process.
If available, the reference ID is also displayed.
Start time
The exact date and time at which the charging session began.
End time
The exact date and time at which the charging session ended.
Energy (kWh)
Shows the amount of electricity supplied during the charging process.
Start price
Shows the fixed connection or start-up charge incurred prior to energy billing, if configured.
Charging price
Displays the calculated charging costs based on the configured price profile.
Where applicable, this amount includes the Eponet platform fee.
Totals
Two summary lines are displayed at the end of the report.
Page total (TOTAL NUMBER OF PAGES)
Calculates the totals only for the records currently visible on the active page.
This value changes when switching between report pages.
Total (TOTAL)
Displays the totals for all transactions that match the selected filters, regardless of pagination.
This allows users to track the entire billing history without having to add up the page totals manually.
Exporting the report
The ‘Top-up Transactions’ page supports the export of the currently filtered report.
Only transactions that match the active filters are included in the exported file.
Before exporting, users should check the following:
- Correct date range
- Correct charger selection
- RFID filter
- Search criteria