Introduction to the Charger Dashboard
Description – An overview of the Charger Dashboard – the central control console for monitoring all charging stations.
Dashboard layout and navigation:
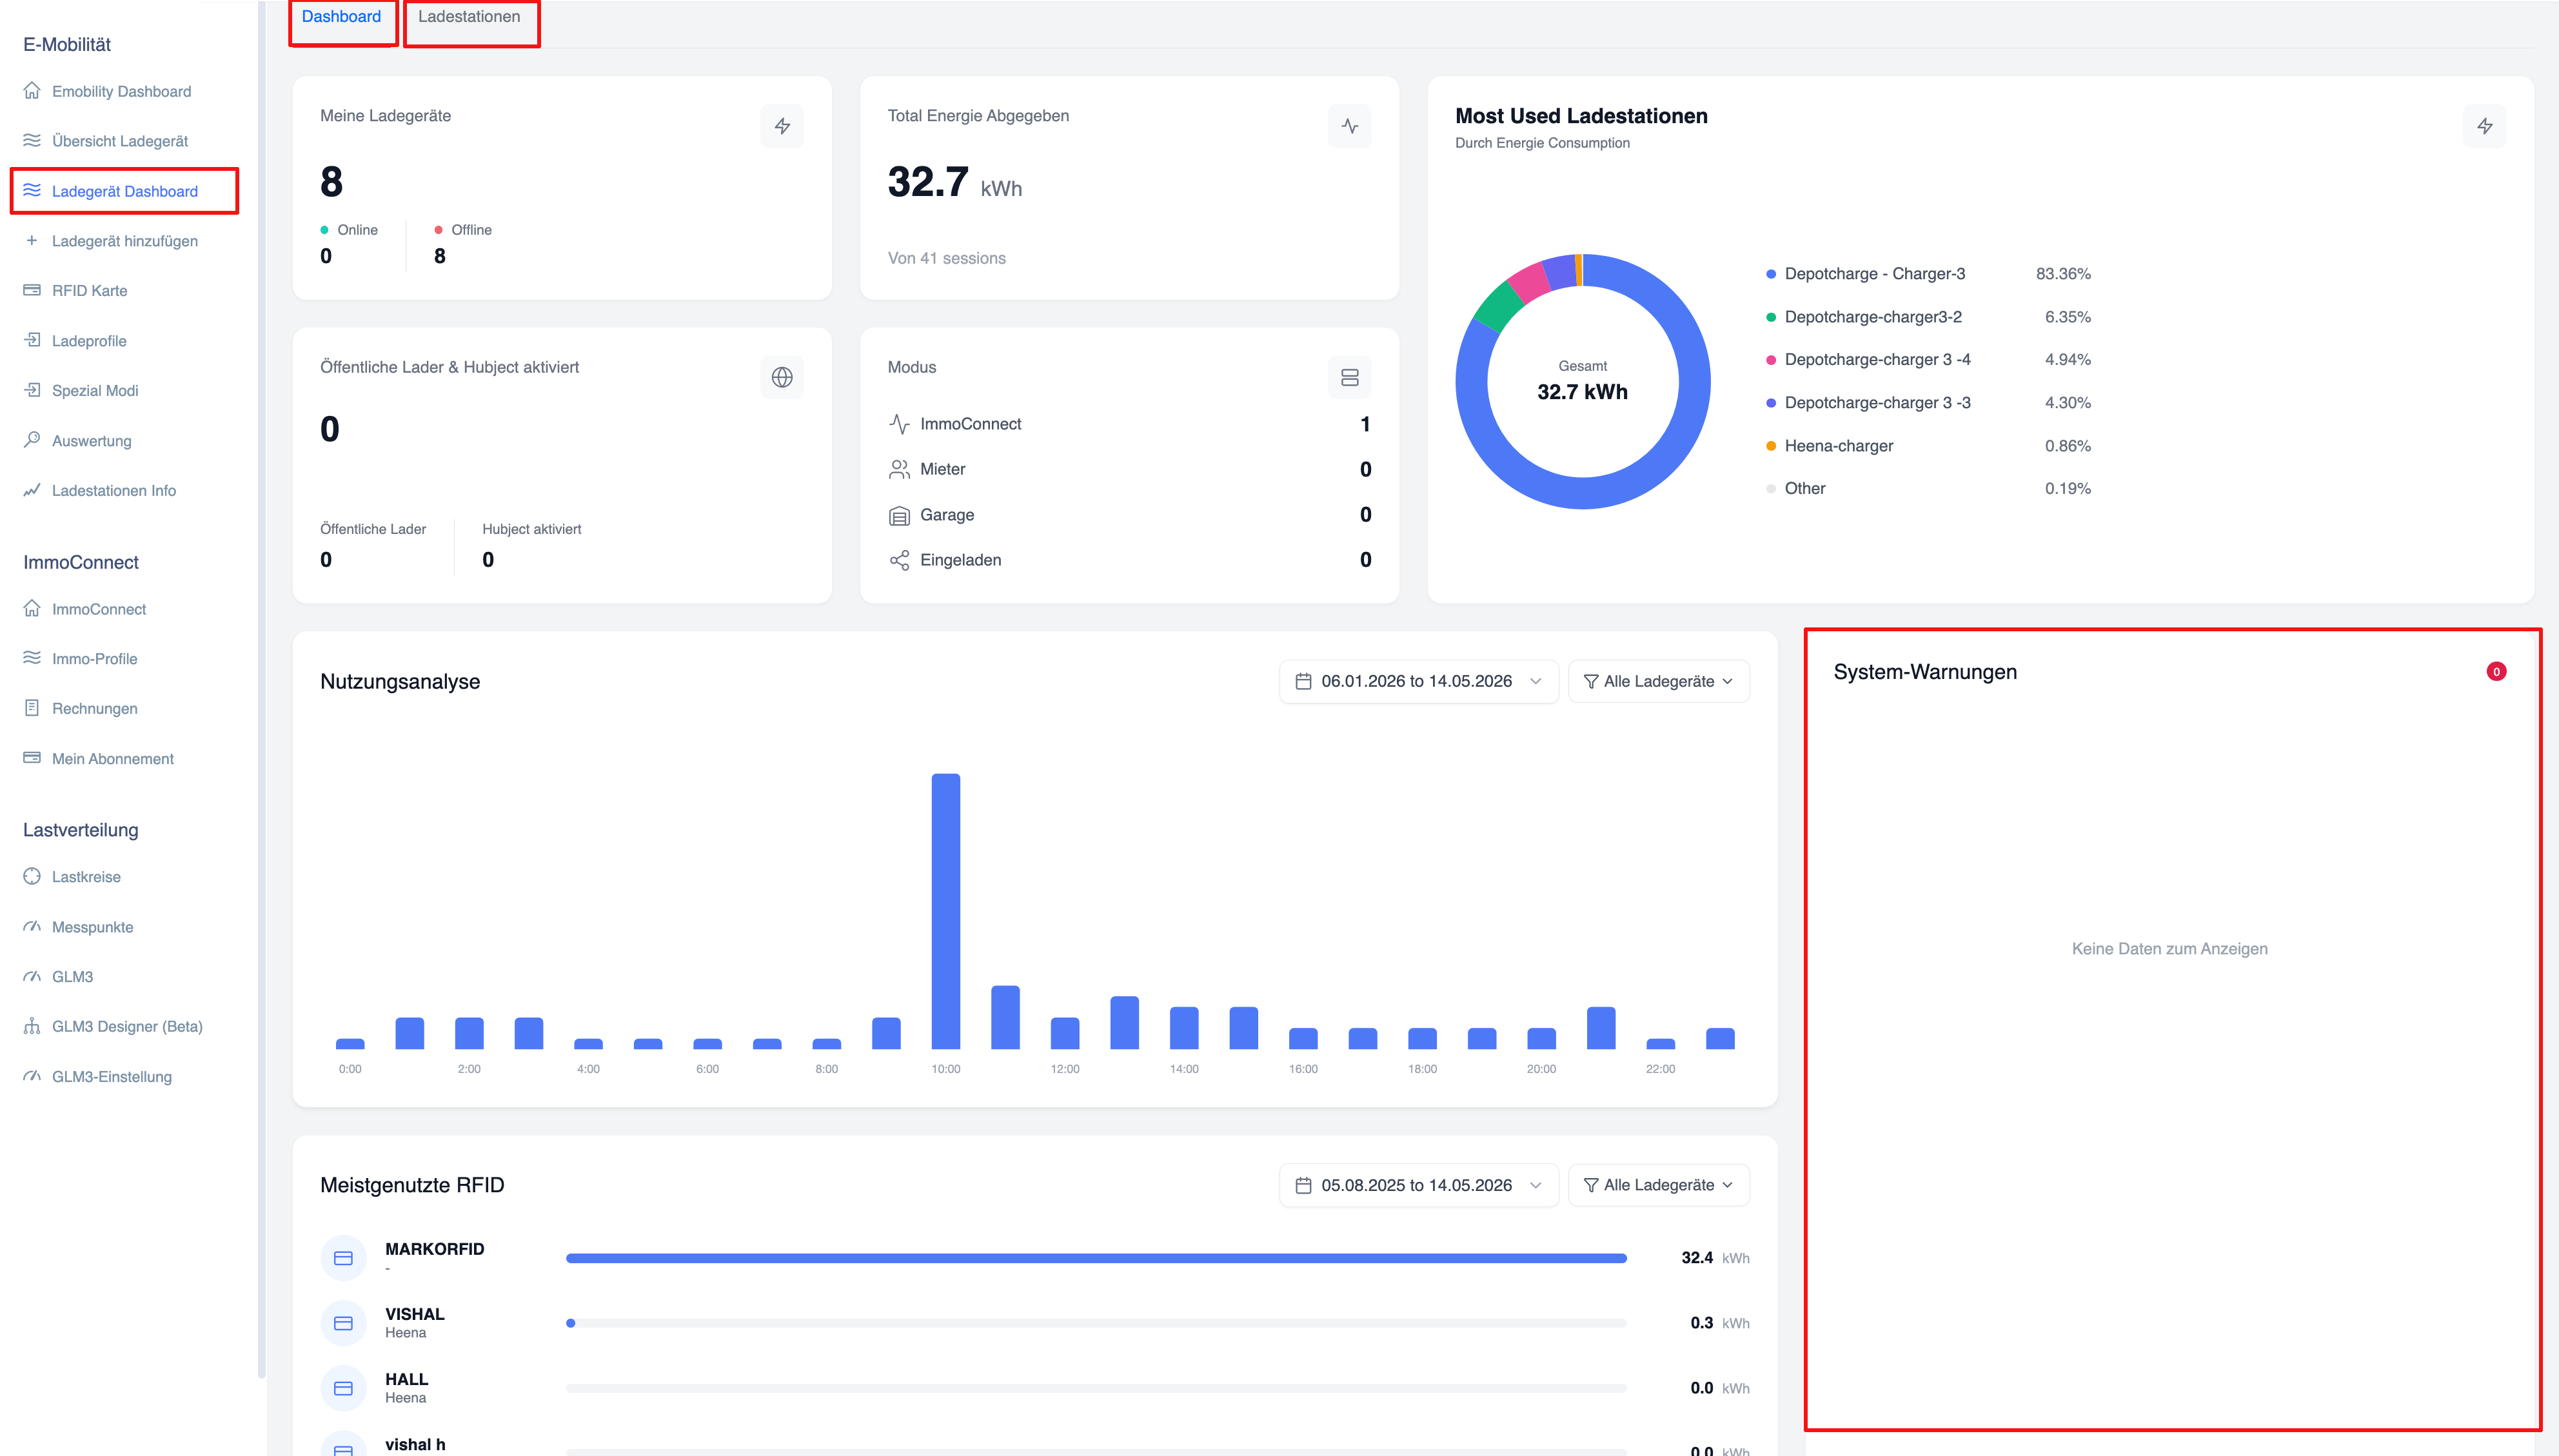
The main dashboard can be accessed via the left-hand sidebar under E-mobility → Charger Dashboard. The top navigation bar contains two tabs: Dashboard and Charging Stations.
Overview maps:
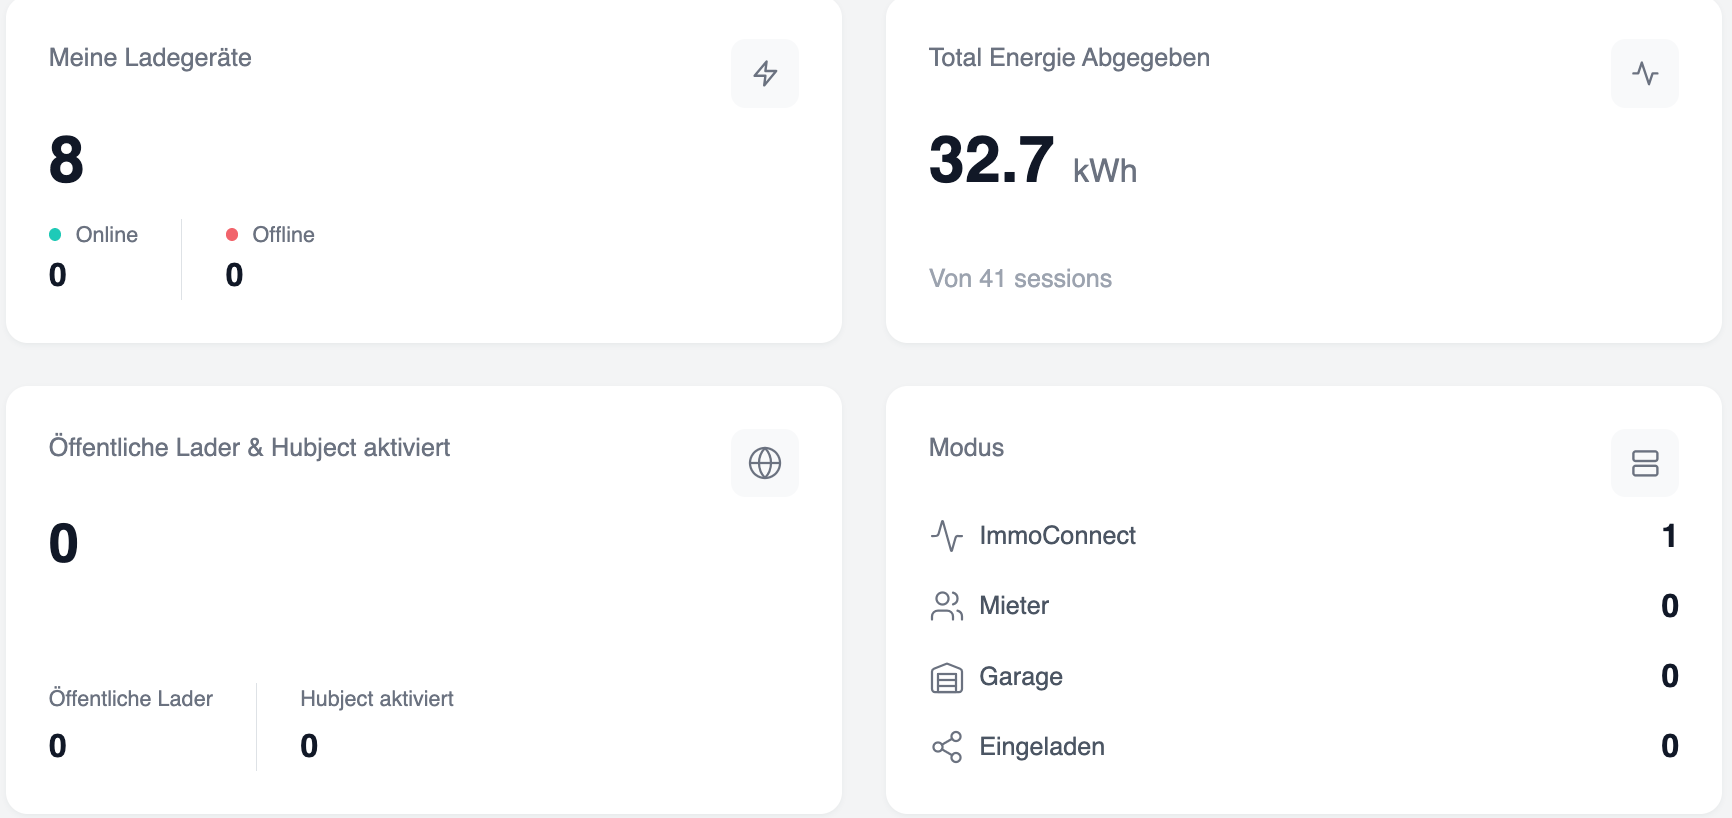
The dashboard displays four overview cards at the top:
- My Chargers: Displays the total number of chargers (e.g. 8). Broken down into Online (0) and Offline (8).
- Total energy supplied: Displays the total energy supplied in kWh (e.g. 32.7 kWh) across all charging sessions (e.g. 41 charging sessions).
- Public chargers & Hubject-activated: Displays the number of public chargers (0) and Hubject-activated chargers (0).
- Mode: Categorises the charging stations by operating mode – ImmoConnect (1), Tenant (0), Garage (0), Charging (0).
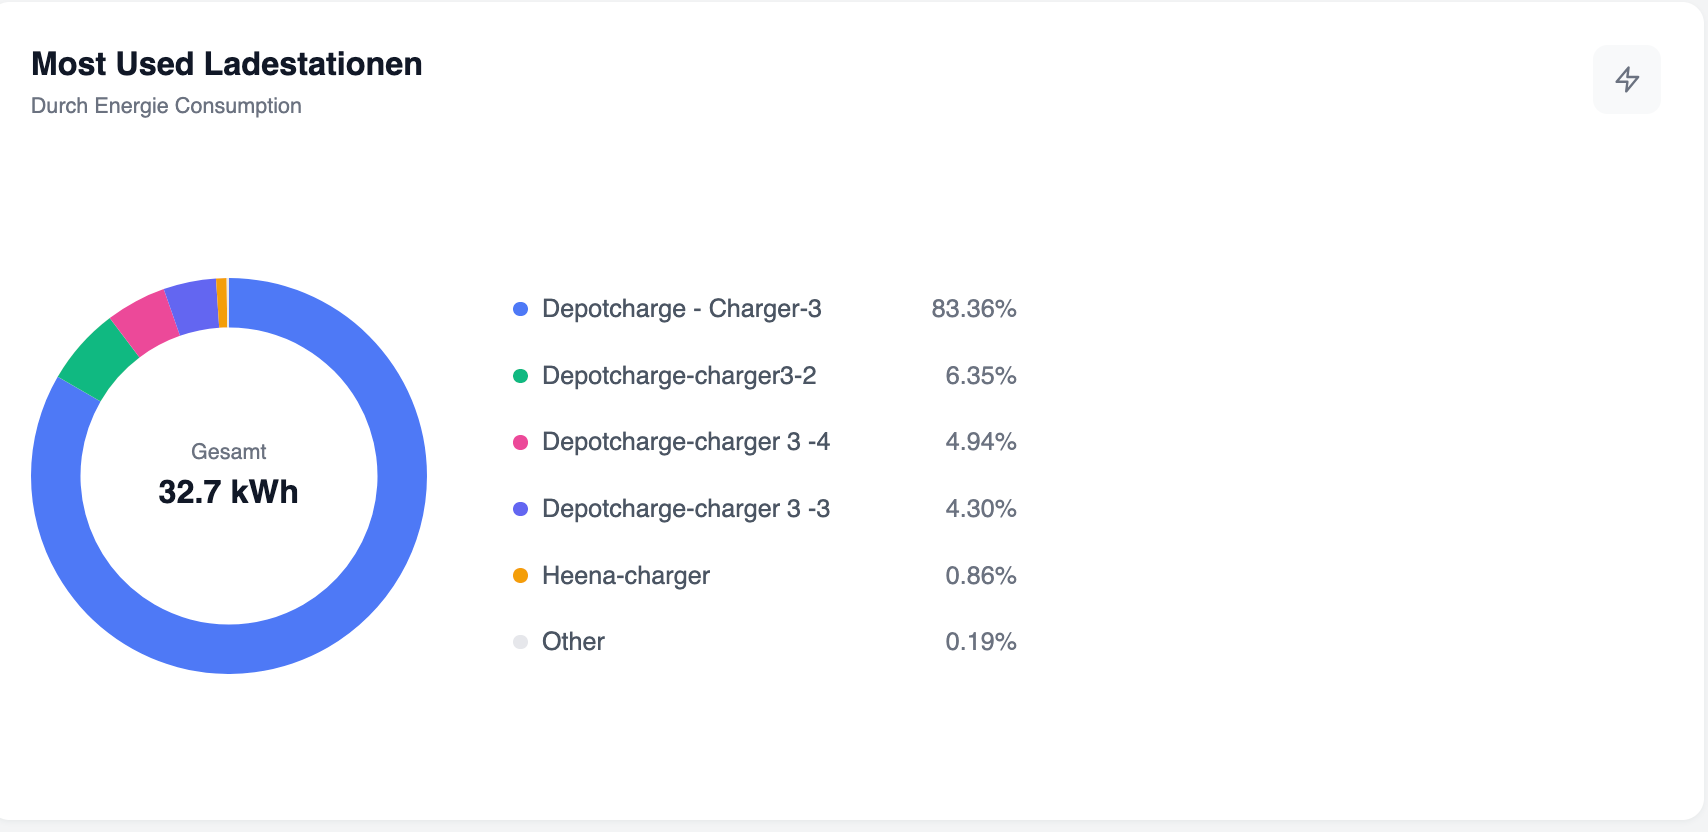
Most frequently used charging stations (doughnut chart):
A doughnut chart titled “Most frequently used charging stations – By energy consumption” is displayed in the top right-hand corner of the dashboard. It shows the percentage of energy consumption per charging station. Sample data: Depotcharge - Charging Station 3 (83.36%), Depotcharge-Charging Station 3-2 (6.35%), Depotcharge 3-4 (4.94%), Depotcharge 3-3 (4.30%), Heena Charging Station (0.86%), Others (0.19%). Total value in the middle: 32.7 kWh.
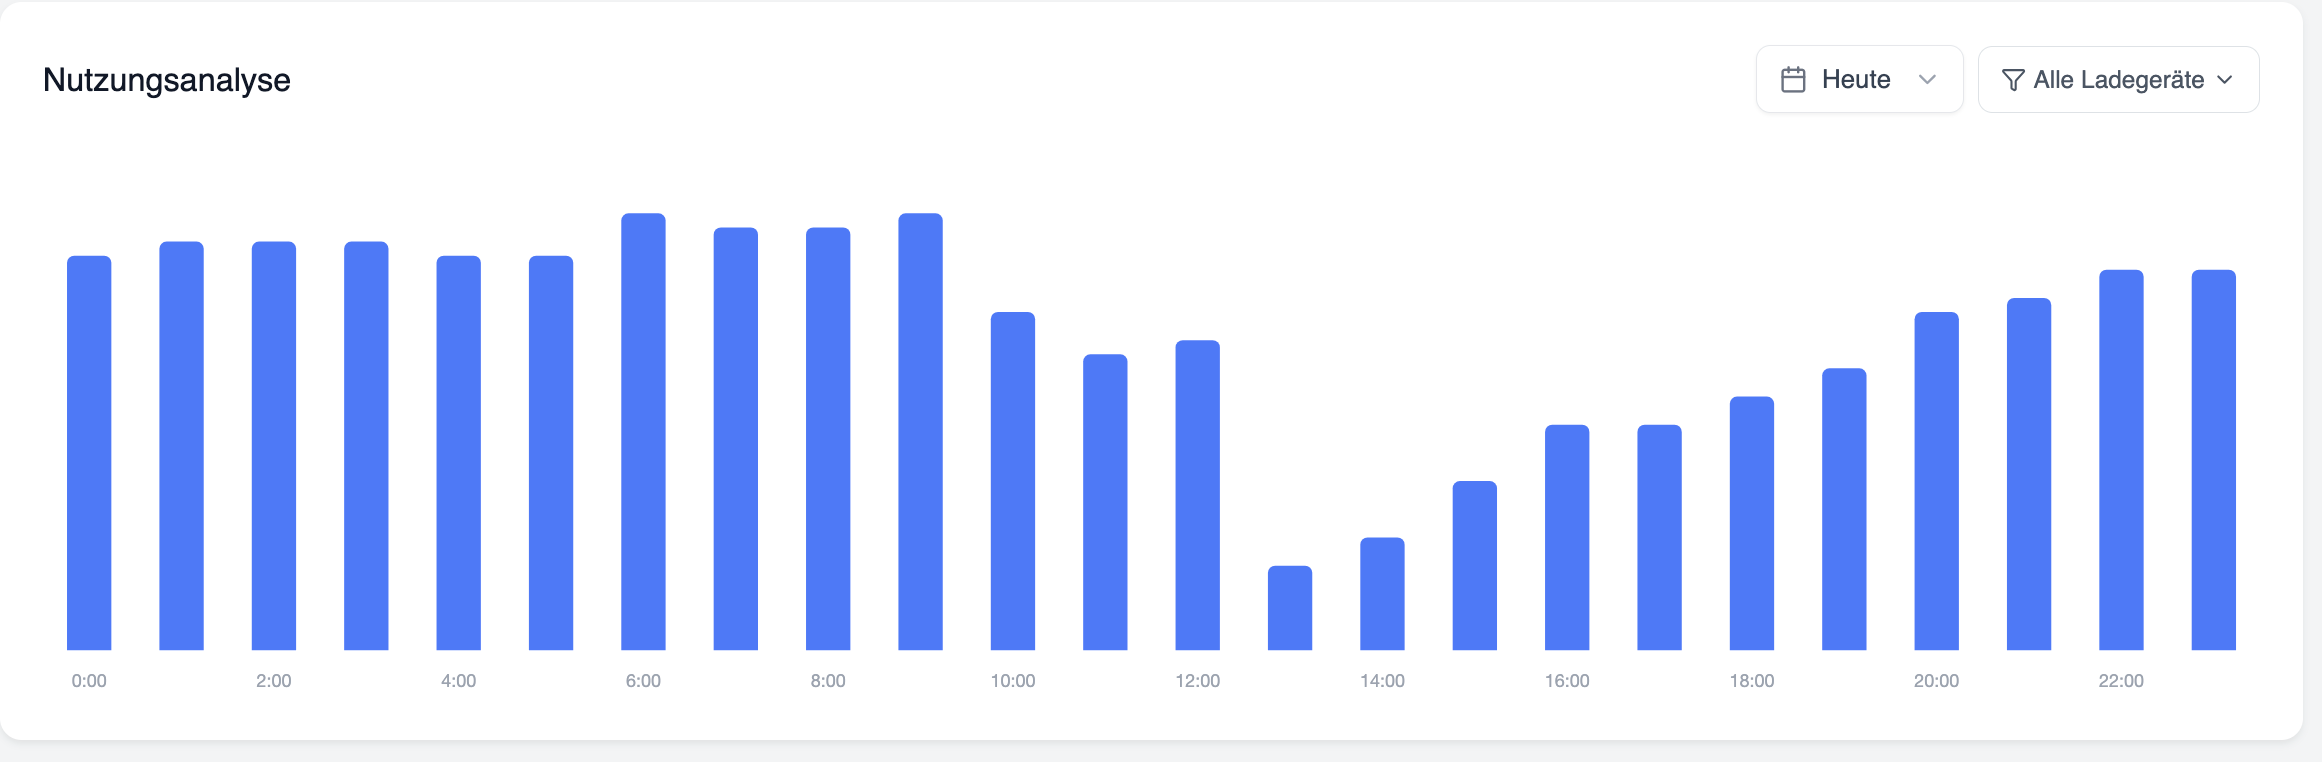
Usage analysis chart
A bar chart showing energy consumption by time of day. The date range is selectable (e.g. 06/01/2026 to 14/05/2026). A drop-down menu for filtering by charger (“All chargers”) allows you to filter by specific chargers. The X-axis shows the hours (00:00 to 22:00). Peak values can be seen at 10:00.
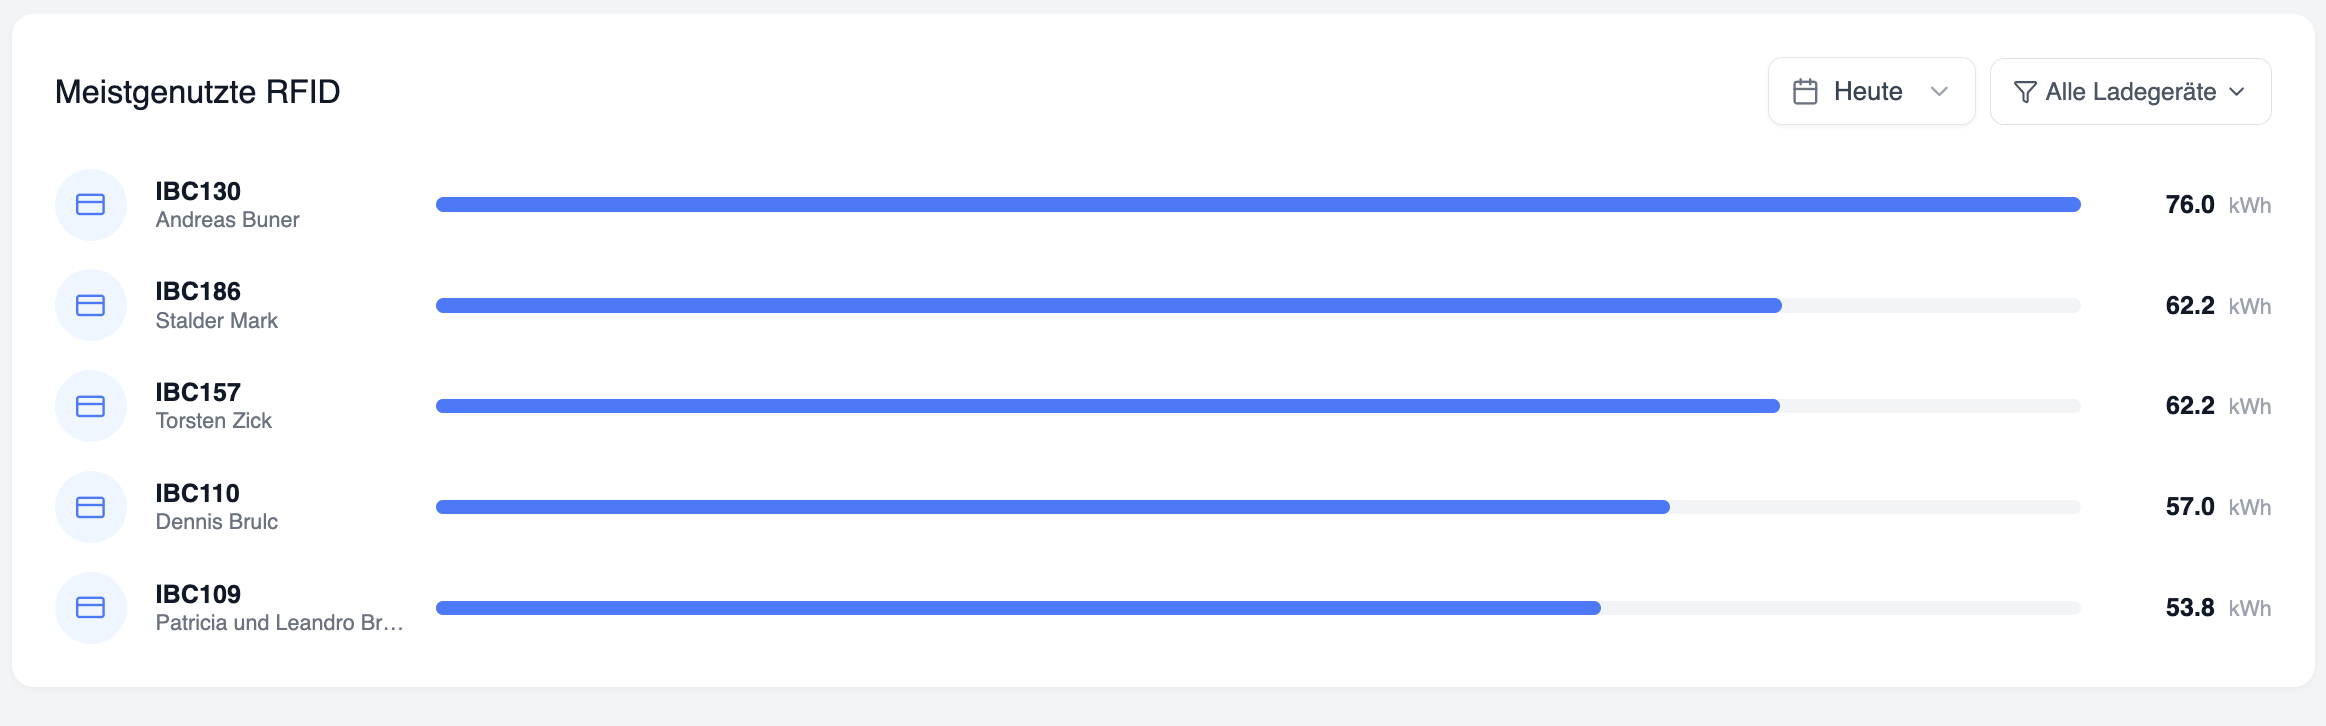
Most frequently used RFID cards
A list of RFID cards sorted by energy consumption is displayed below the consumption chart. A filter for the date range and a filter for chargers are available.
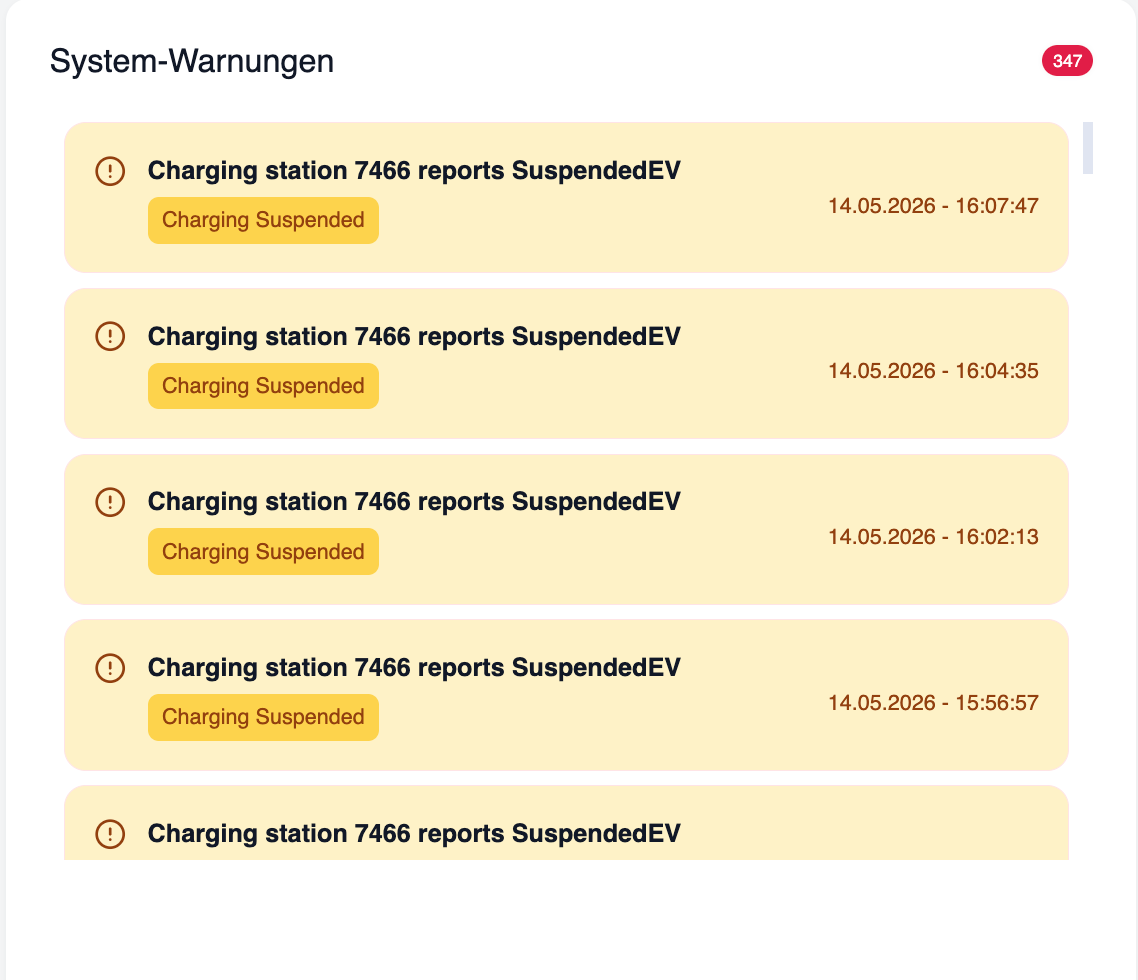
System alerts
On the right-hand side of the dashboard, a ‘System Alerts’ section displays active alerts with a red badge count. Each alert entry displays the following: Title (e.g. “Charging station 1 reports SuspendedEVSE”), a status description (e.g. “Charging interrupted” in orange) and a timestamp (e.g. 13 May 2026 – 16:37:04). If there are no warnings, the field displays “No data to display”.